Effective ECG interpretation depends not only on the technical analysis of the tracing but also on the ability to place the test within the patient's clinical reality. This is where Bayesian ECG analysis stands out: by combining the pretest probability that the patient has the suspected condition with the electrocardiographic findings, it allows the post-test probability of the suspected diagnosis to be calculated. Unlike traditional approaches based only on sensitivity and specificity, this tool offers a broader and more individualized view, increasing diagnostic accuracy and strengthening clinical decision-making.
Bayesian Analysis
Bayesian analysis offers three tools to aid ECG interpretation:
- Bayes tree
- Fagan nomogram
- Direct calculation
Clinical Case
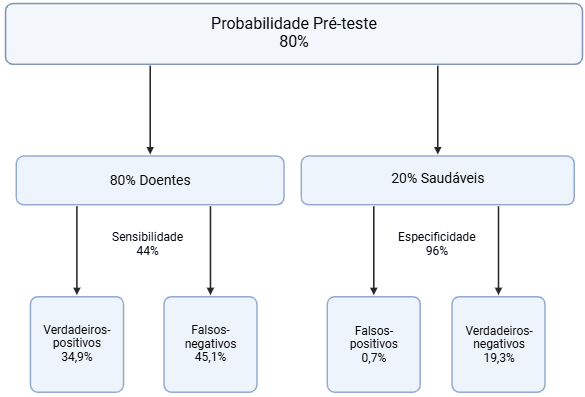
A 75-year-old man with hypertension and diabetes presents to the emergency department with pressure-like retrosternal chest pain radiating to the jaw and left arm. Based on the clinical context, the pretest probability of occlusion myocardial infarction (OMI) is estimated at 80%. However, the ECG shows no ST-segment elevation. Using the following data on ST-segment elevation, Bayesian ECG analysis can be applied.
- Sensitivity: 43.6%
- Specificity: 96.5%
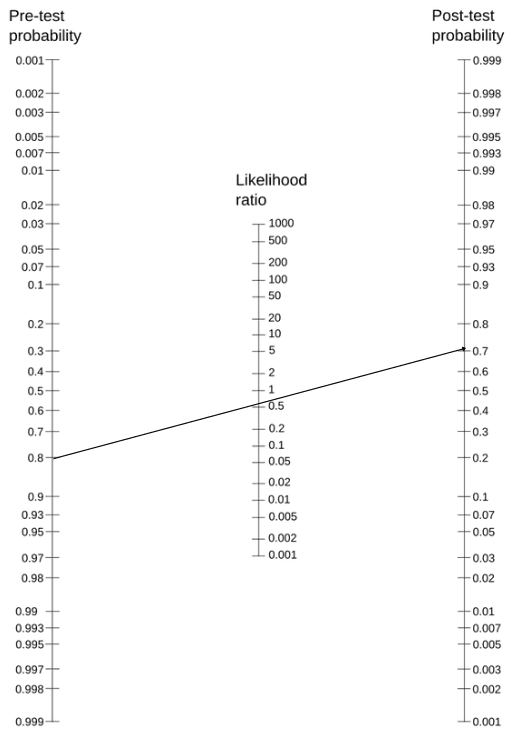
- Positive likelihood ratio: 12.5
- Negative likelihood ratio: 0.58
- Bayes tree

- Fagan nomogram
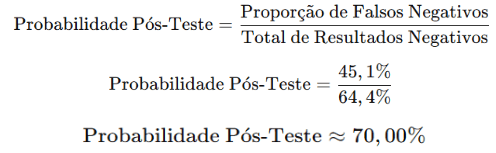
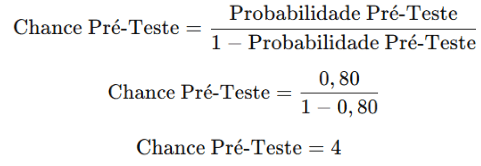
- Direct calculation
- Converting pretest probability into pretest odds:
- Converting pretest odds into post-test odds:

- Converting post-test odds into post-test probability:
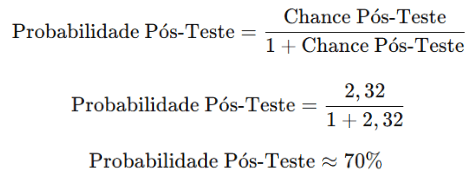
This clinical case shows that, even without ST-segment elevation on the ECG, the patient still has a high probability of OMI. This reinforces the importance of Bayesian ECG analysis as a tool to increase diagnostic accuracy and, consequently, provide more appropriate and effective treatment.
Learn More
To learn more about the basis of Bayesian reasoning, see the Manual de Medicina Baseada em Evidências (in Portuguese).
References
- de Alencar Neto JN. Applying Bayesian reasoning to electrocardiogram interpretation. J Electrocardiol. 2023;81:295-299.
- de Alencar Neto JN, Scheffer MK, Correia BP, Franchini KG, Felicioni SP, De Marchi MFN. Systematic review and meta-analysis of diagnostic test accuracy of ST-segment elevation for acute coronary occlusion. Int J Cardiol. 2024;402:131889.
- Scheffer MK, De Marchi MFN, de Alencar Neto JN, Felicioni SP. Eletrocardiograma de A a Z. São Paulo: Manole, 2024.