

Hyperkalemia causes progressive electrocardiographic changes that reflect the impact of increased potassium on the membrane potential of cardiac cells. It is defined as a serum potassium level > 5.0 mEq/L.
ECG Changes
- High-amplitude, symmetric, narrow-based T wave, producing a peaked appearance (“tented” T wave)
- Progressive decrease of the P wave associated with progressive lengthening of the PR interval
- Increased QRS duration
- Sine-wave rhythm preceding malignant arrhythmias such as ventricular fibrillation and asystole
ECG in Hyperkalemia
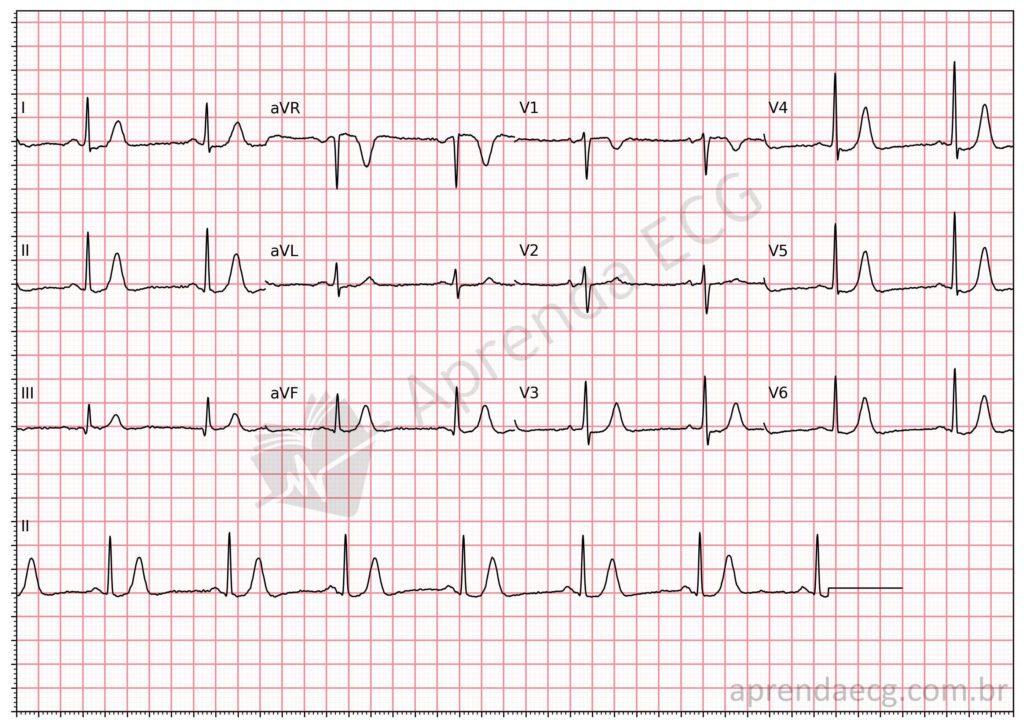
Hyperkalemia. Note the high-amplitude, symmetric T waves.
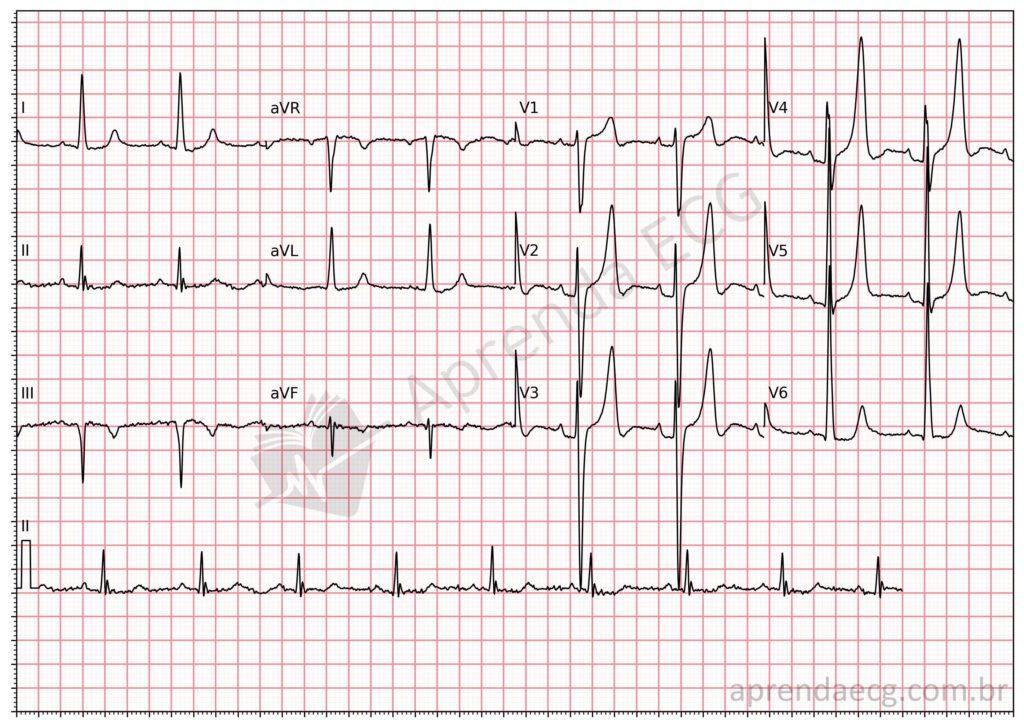
Hyperkalemia. ECG with signs of LVH and peaked T waves in a patient with chronic kidney disease.
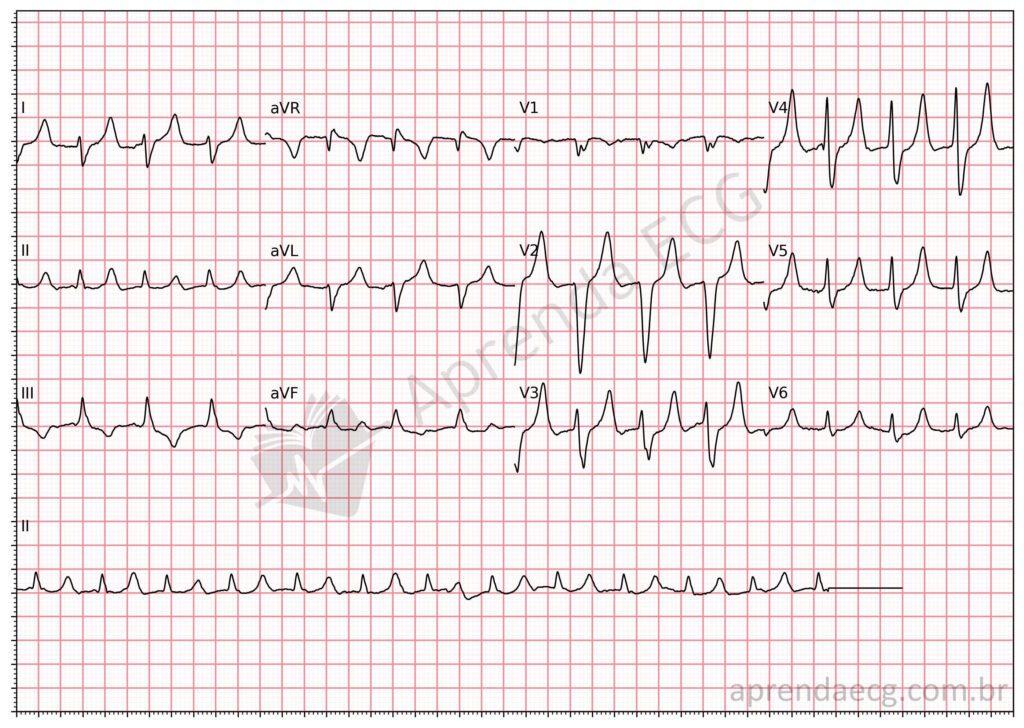
Hyperkalemia. In this example, in addition to peaked T waves, we see flattening of the P wave and increased QRS duration.
Classic ECG Changes in Hyperkalemia
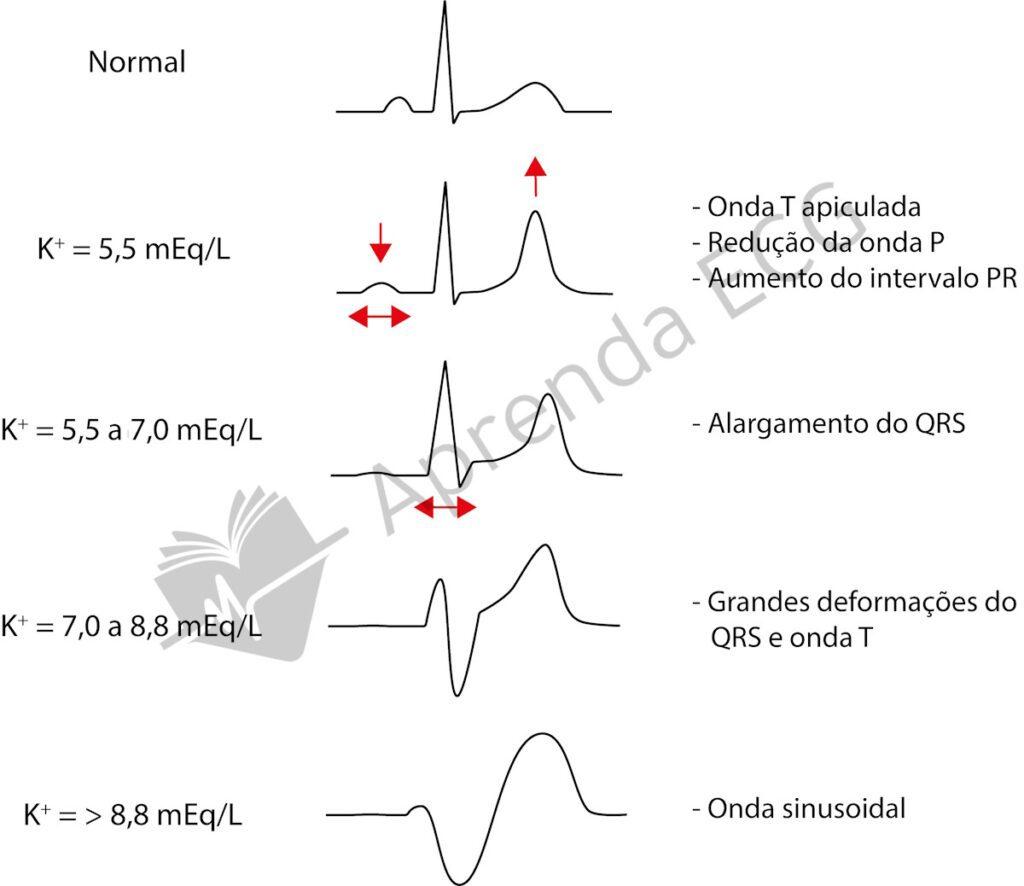
ECG manifestations vary according to the serum potassium level:
- 5.5 – 6.5 mEq/L: tall, symmetric, narrow-based T wave (“tented” appearance).
- 6.5 – 7.0 mEq/L: reduced P-wave amplitude and progressive lengthening of the PR interval.
- 7.0 – 9.0 mEq/L: progressive widening of the QRS complex, possibly with ST-segment changes.
- > 9.0 mEq/L: sine-wave pattern on the ECG, associated with a high risk of ventricular fibrillation (VF) and asystole.
Further Reading
Related Topics
References
- Scheffer MK, De Marchi MFN, de Alencar Neto JN, Felicioni SP. Eletrocardiograma de A a Z. São Paulo: Manole, 2024.
- de Alencar JN, de Andrade Matos VF, Scheffer MK, Felicioni SP, et al. ST segment and T wave abnormalities: A narrative review. J Electrocardiol. 2024;85(500):7–15.


