The term “strain” pattern in electrocardiography dates back to the 1920s, when it was associated with the left ventricle’s “effort” to pump blood under stress conditions such as hypertension and aortic stenosis. However, as research advanced, understanding of the heart’s electrical changes deepened. “Strain” came to be seen as a marker of left ventricular electrical remodeling, a process that occurs in many heart diseases.
The concept of the “ventricular gradient” was introduced by Wilson as the algebraic sum of the QRS and ST-T areas. Although theoretically zero, the ventricular gradient is influenced by several factors, including left ventricular mass and local, regional, and global electromechanical activity. The left ventricular “strain” pattern can reflect all of these influences, as well as prolonged depolarization.
The left ventricular “strain” pattern is much more complex than a simple voltage measurement. Historically, ECG analysis focused almost exclusively on QRS voltage criteria to diagnose left ventricular hypertrophy. However, the “strain” pattern, which involves ST-T changes, provides more detailed information about the condition of the myocardium. This complexity results from the interaction of several factors, such as electrical and anatomical remodeling of the heart and the influence of local, regional, and global pathological processes.
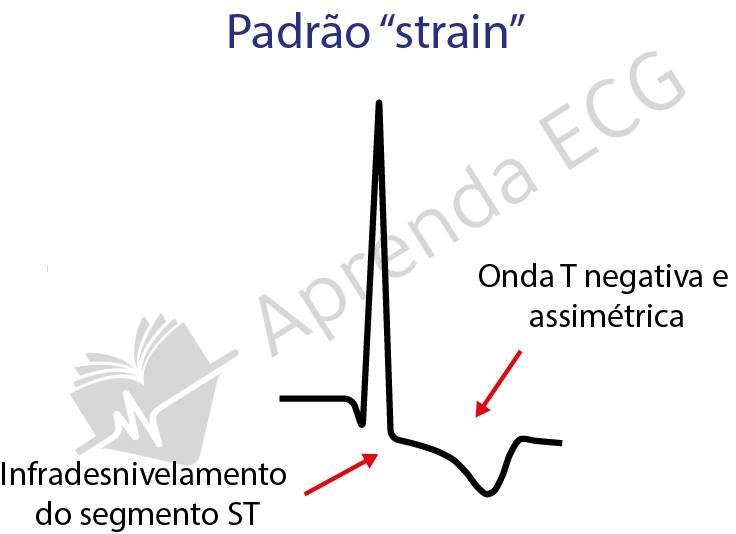
The left ventricular “strain” pattern is not static, but a dynamic process that evolves over time.
Initially, ST-segment depression is seen with T waves that are still positive. Next, the T waves gradually flatten until they invert, accompanied by a downsloping ST segment. Finally, the ST segment takes on an upward-convex morphology, followed by asymmetric negative T waves. This final pattern is generally associated with more advanced myocardial disease. In addition, QRS duration and morphology are also related to the “strain” pattern, reflecting the presence of changes in the heart’s electrical conduction.
Reducing ventricular pressure can lead to regression or resolution of the “strain” pattern, regardless of the type of therapeutic intervention. Recent studies have shown that reduction of “strain” is more strongly related to blood pressure control than to changes in ventricular mass. This highlights the dynamic and rapidly changing nature of this pattern. It has also proven to be a crucial clinical marker, especially in the setting of hypertension. Studies show that the presence and evolution of this pattern are associated with a higher risk of adverse cardiovascular events, such as nonfatal infarction and cardiovascular death.
Quantifying and interpreting the “strain” pattern remains challenging.
Defining precise criteria to identify and classify “strain” is essential for standardizing research and clinical application. Combining different methods of analysis, such as the ECG and echocardiography, can provide more complete information on ventricular function and assist in the differential diagnosis of many heart conditions.
Learn more
To deepen your knowledge, see our article on the Peguero-Lo Presti criterion for diagnosing left ventricular hypertrophy. Also visit the ECG Library to access detailed tracings on the diagnostic criteria for ventricular hypertrophy, essential for your learning in electrocardiography.
References
- Scheffer Mk, De Marchi MFN, de Alencar Neto JN, Felicioni, SP. Eletrocardiograma de A a Z. 2024.
- Schocken DD. Electrocardiographic left ventricular strain pattern: Everything old is new again. J Electrocardiol 2014; 47: 595.
- Okin PM, Oikarinen L, Viitasalo L, et al. Prognostic value of changes in the electrocardiographic strain pattern during antihypertensive treatment: the LIFE study. Circulation 2009;119:1183.
- Okin PM, Devereux RB, Nieminen MS, et al. Relationship of the electrocardiographic strain pattern to left ventricular structure and function in hypertensive patients: the LIFE study. J Am Coll Cardiol 2001;38:514–20.
- Larsen CT, Dahlin J, Blackburn H, et al. Prevalence and prognosis of left ventricular hypertrophy, ST segment depression and negative T-wave, the Copenhagen City Heart Study. Eur Heart J 2002;23:315–24.