

The U wave on the ECG is the last deflection of the ventricular electrical cycle visible on the surface electrocardiogram (ECG). It appears after the T wave and before the next P wave, and is traditionally considered a phenomenon related to the final phase of ventricular repolarization.
Although it was described more than a century ago, its electrophysiological origin remains partly controversial. In clinical practice it is usually ignored, which is a mistake when its morphology is abnormal.
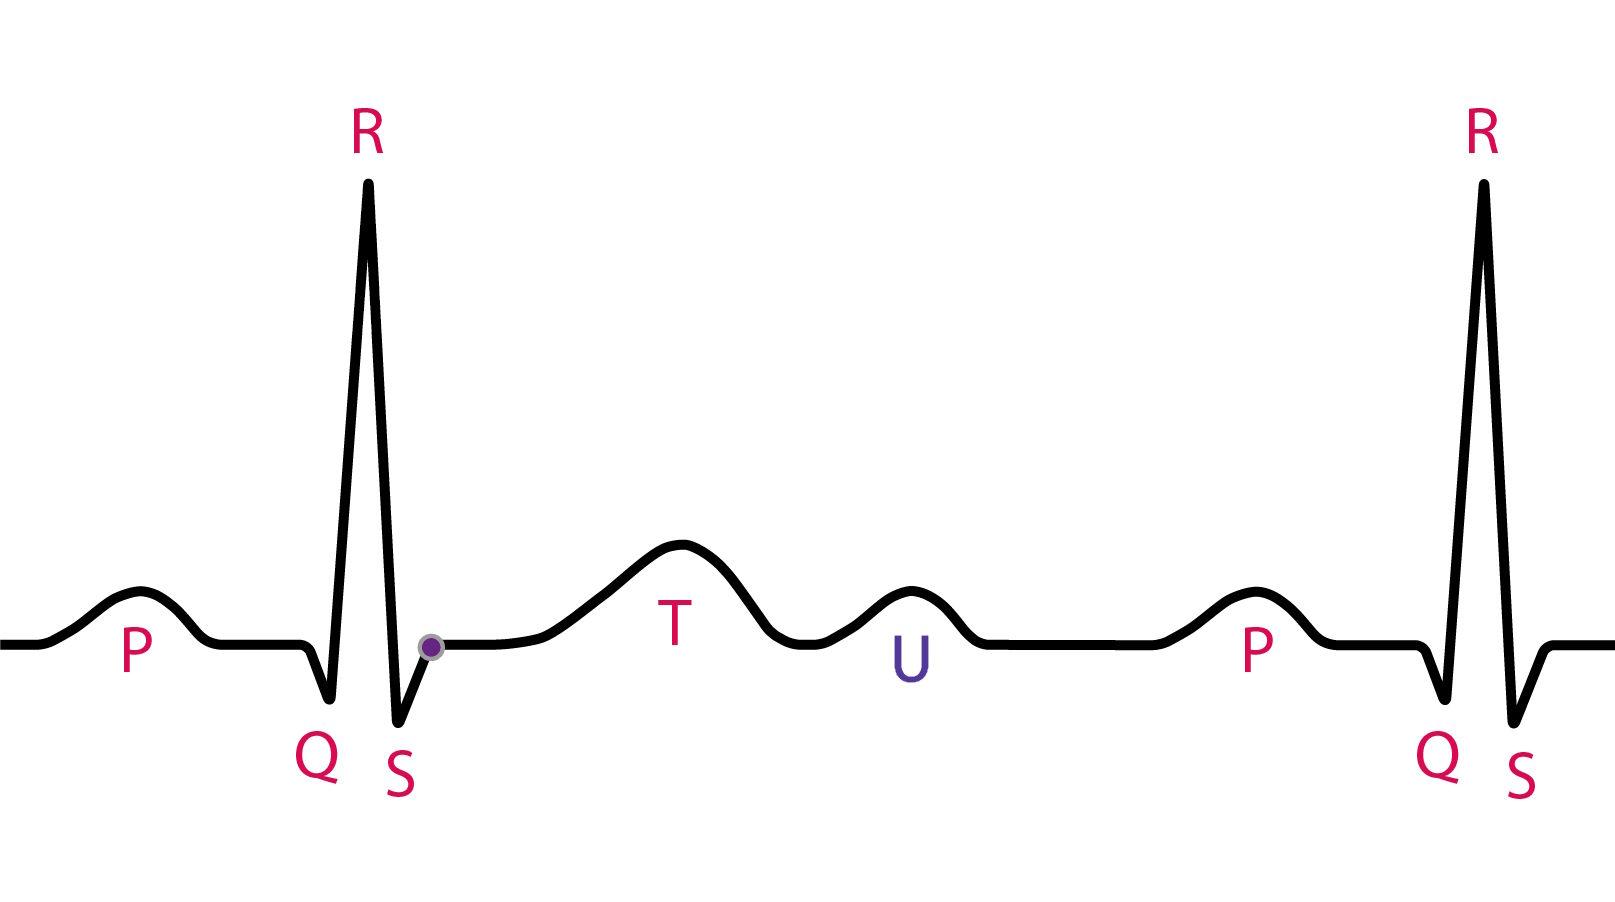
Definition and electrocardiographic features
The U wave has relatively constant features on the normal ECG:
- It is located after the T wave and before the next P wave
- It usually has the same polarity as the T wave
- Amplitude < 25% of the T-wave amplitude
- Usual height < 0.15 mV
- Duration of approximately 160–200 ms
- Best seen in precordial leads V2 and V3
It is more evident at low heart rates, being seen in more than 90% of ECGs with HR < 65 bpm. At high rates it may merge with the following P wave.
Criteria for abnormality include:
- Amplitude ≥ 0.5 mV
- Amplitude equal to or greater than the preceding T wave
- Inverted polarity (negative U wave)
Pathophysiology of the U wave
The origin of the U wave has not yet been definitively established. Three main mechanisms have been proposed.
1. Late repolarization of M cells
The most widespread theory links the U wave to transmural dispersion of ventricular repolarization, especially to the M cells of the midmyocardium.
These cells have a longer action potential than epicardial and endocardial cells. The late electrical gradient between these layers could generate the deflection corresponding to the U wave.
This hypothesis explains:
- The relationship with long QT
- The association with early afterdepolarizations (EADs)
- Greater prominence in hypokalemia
Limitation: the difference in action potential duration alone may not account for the full morphology seen on the surface ECG.
2. Modulation by the IK1 current
More recent studies suggest that the U wave may reflect potential differences dependent on the inward rectifier potassium current (IK1), particularly in the terminal phase of repolarization (phase 3/4).
Genetic or functional changes in this current modulate the morphology, amplitude, and polarity of the U wave.
This hypothesis reinforces that the U wave is part of the repolarization process rather than an isolated mechanical phenomenon.
3. Mechanoelectrical hypothesis
It proposes that the U wave results from afterpotentials generated by myocardial stretch during ventricular relaxation.
Although appealing, modern evidence suggests that this mechanism does not explain the normal physiological U wave and may play a role only in pathological situations with ventricular overload.
Practical summary: the physiological U wave and the pathological U wave probably do not share exactly the same mechanism.
U-wave abnormalities
Prominent U wave
Main causes:
- Hypokalemia (classic)
- Bradycardia
- Long QT syndrome (congenital or acquired)
- Drugs with a quinidine-like effect
- Digitalis use
In hypokalemia, the T–U complex may represent abnormally prolonged ventricular repolarization rather than an isolated “true U wave.”
Increased U-wave amplitude is associated with greater electrical instability and may precede torsades de pointes when combined with a prolonged QT.
Negative U wave
U-wave inversion is highly specific for structural heart disease.
Main associations:
- Myocardial ischemia (especially anterior)
- Left ventricular hypertrophy
- Hypertension
- Left ventricular overload
- Aortic valve disease
Dynamic changes in U-wave polarity may precede ST-segment changes during episodes of ischemia.
A negative U wave is associated with a worse prognosis in men, including higher cardiovascular mortality.
T–U fusion and its impact on QT measurement
Distinguishing the end of the T wave from the onset of the U wave can be difficult.
When there is T–U fusion:
- The QT interval may be overestimated
- In some settings the QU interval should be considered
- The analysis should always be correlated with the clinical context and overall morphology
Practical points for interpretation
- Always compare with a previous ECG
- A new or inverted U wave deserves investigation
- Bradycardia + tall U wave → look for hypokalemia
- A negative U wave in V4–V6 has high value for structural disease
- In chest pain, U-wave changes may represent early ischemia
The U wave is rarely given attention in routine practice, but when abnormal it carries relevant clinical information.
References
- Kihlgren M, Almqvist C, Amankhani F, et al. The U-wave: A remaining enigma of the electrocardiogram. J Electrocardiol. 2023;79:13-20. DOI: 10.1016/j.jelectrocard.2023.03.001.
- Rautaharju PM, Surawicz B, Gettes LS, et al. AHA/ACCF/HRS recommendations for the standardization and interpretation of the electrocardiogram: part IV: the ST segment, T and U waves, and the QT interval. J Am Coll Cardiol. 2009;53(11):982-991. DOI: 10.1016/j.jacc.2008.12.014.
- Antzelevitch C, Sicouri S. Clinical relevance of cardiac arrhythmias generated by afterdepolarizations. Role of M cells in the generation of U waves, triggered activity and torsade de pointes. J Am Coll Cardiol. 1994;23(1):259-277. DOI: 10.1016/0735-1097(94)90529-0.
- Postema PG, Ritsema van Eck HJ, Opthof T, et al. IK1 modulates the U-wave: insights in a 100-year-old enigma. Heart Rhythm. 2009;6(3):393-400. DOI: 10.1016/j.hrthm.2008.11.024.


