

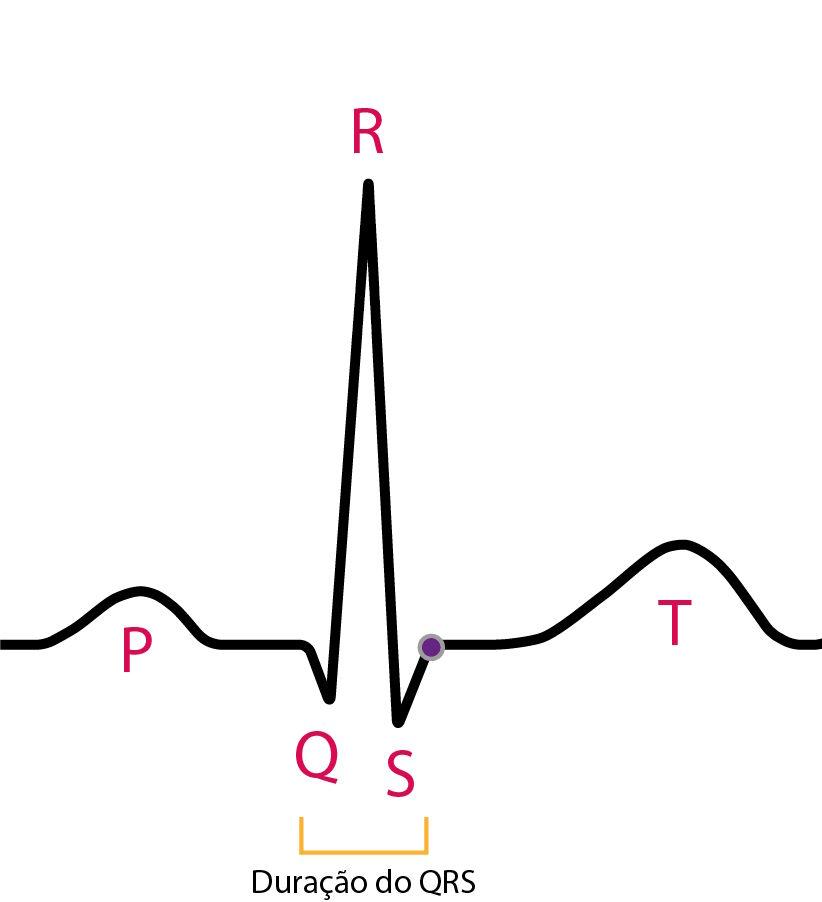
The QRS complex represents ventricular depolarization and is the main electrical signature of the myocardial mass on the electrocardiogram (ECG). Its analysis allows assessment of intraventricular conduction, the presence of necrosis, chamber enlargement, and structural abnormalities.
This schematic summary brings together the fundamental concepts needed to interpret the QRS complex within a systematic morphological approach.
Ventricular Activation
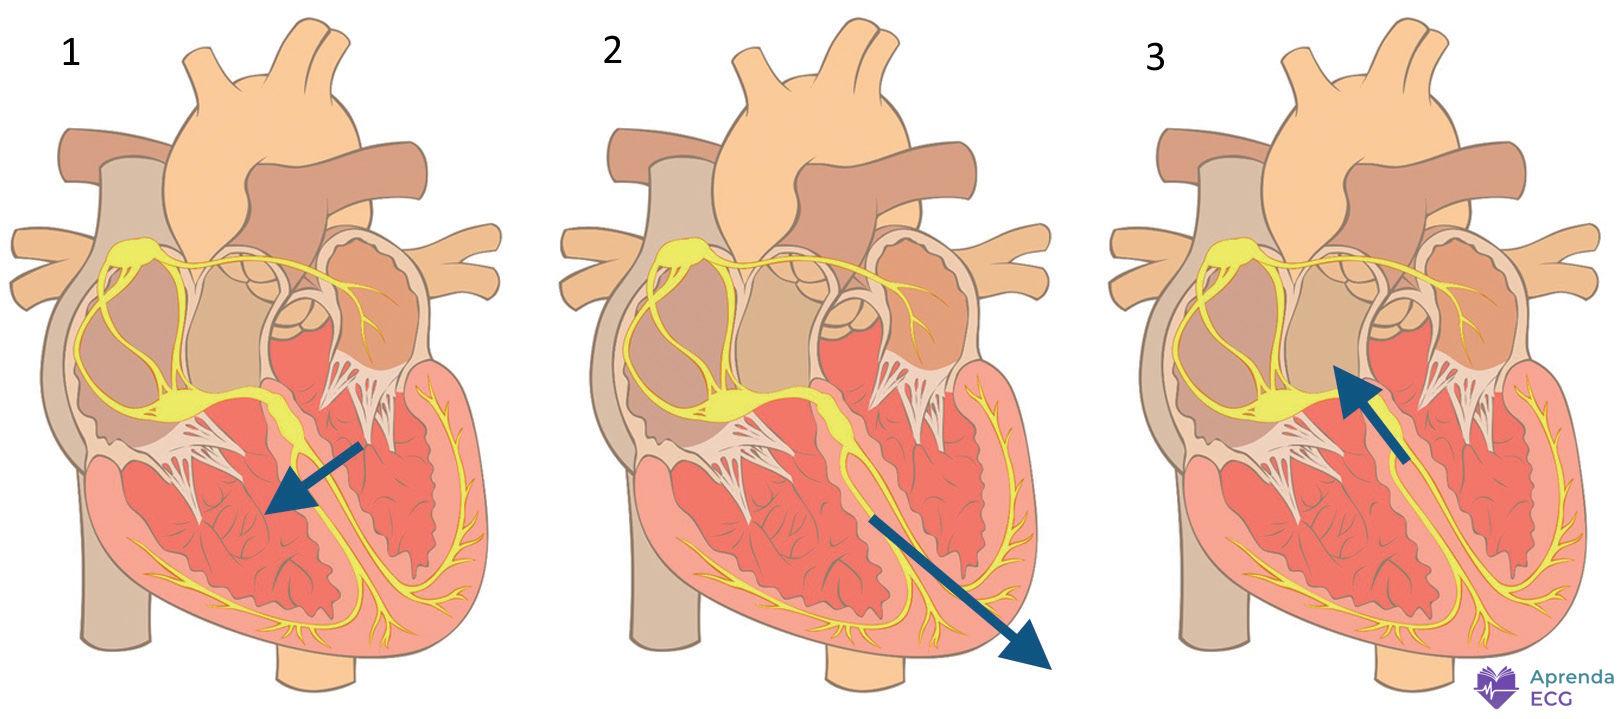
After the physiological delay in the AV node, the impulse travels rapidly through the His-Purkinje system, producing coordinated ventricular activation in an apex-to-base direction.
Ventricular activation can be understood as three main vectors:
1. Septal Vector (initial, 10 to 15 ms)
- Direction: left → right and anterior
- Corresponds to depolarization of the interventricular septum
- Produces:
- Small r wave in V1
- Small q wave in I, aVL, V5, and V6
2. Free Wall Vector (30 to 40 ms)
- Direction: leftward, inferior, and posterior
- Represents the predominant activation of the left ventricle
- Accounts for most of the QRS amplitude
- Produces:
- S wave in V1
- Tall R wave in V5 and V6
3. Basal Vector (terminal, 20 to 30 ms)
- Direction: superior, rightward, and posterior
- May produce:
- Small s waves in the lateral leads
- Terminal r’ in V1
The vector sum of these three moments forms the QRS complex seen on the surface ECG.
Formation of the QRS Complex Waves
Q Wave
- First negative deflection of the complex
- May be physiological or pathological
Physiological (septal) Q wave:
- Small
- Narrow (< 30 ms)
- Depth < 25% of the R wave
- Present in I, aVL, V5, and V6
Pathological Q wave:
- Wider and deeper
- Suggests electrically inactive areas (necrosis/fibrosis)
- Must be present in at least two contiguous leads
Detailed criteria are discussed in the article on Electrically Inactive Areas and in Pathological Q Waves.
R Wave
- First positive deflection of the complex
- Represents activation of the predominant ventricular mass
In the precordial leads:
- Progressive growth of the R wave from V1 to V4 is expected
- The transition zone (R = S) usually occurs between V3 and V4
Changes in R-wave amplitude may indicate:
- Ventricular hypertrophy
- Electrically inactive areas
- Positional changes or normal variants
S Wave
- Negative deflection after the R wave
- Represents late electrical forces directed posteriorly
- Predominates in the right precordial leads (V1-V2)
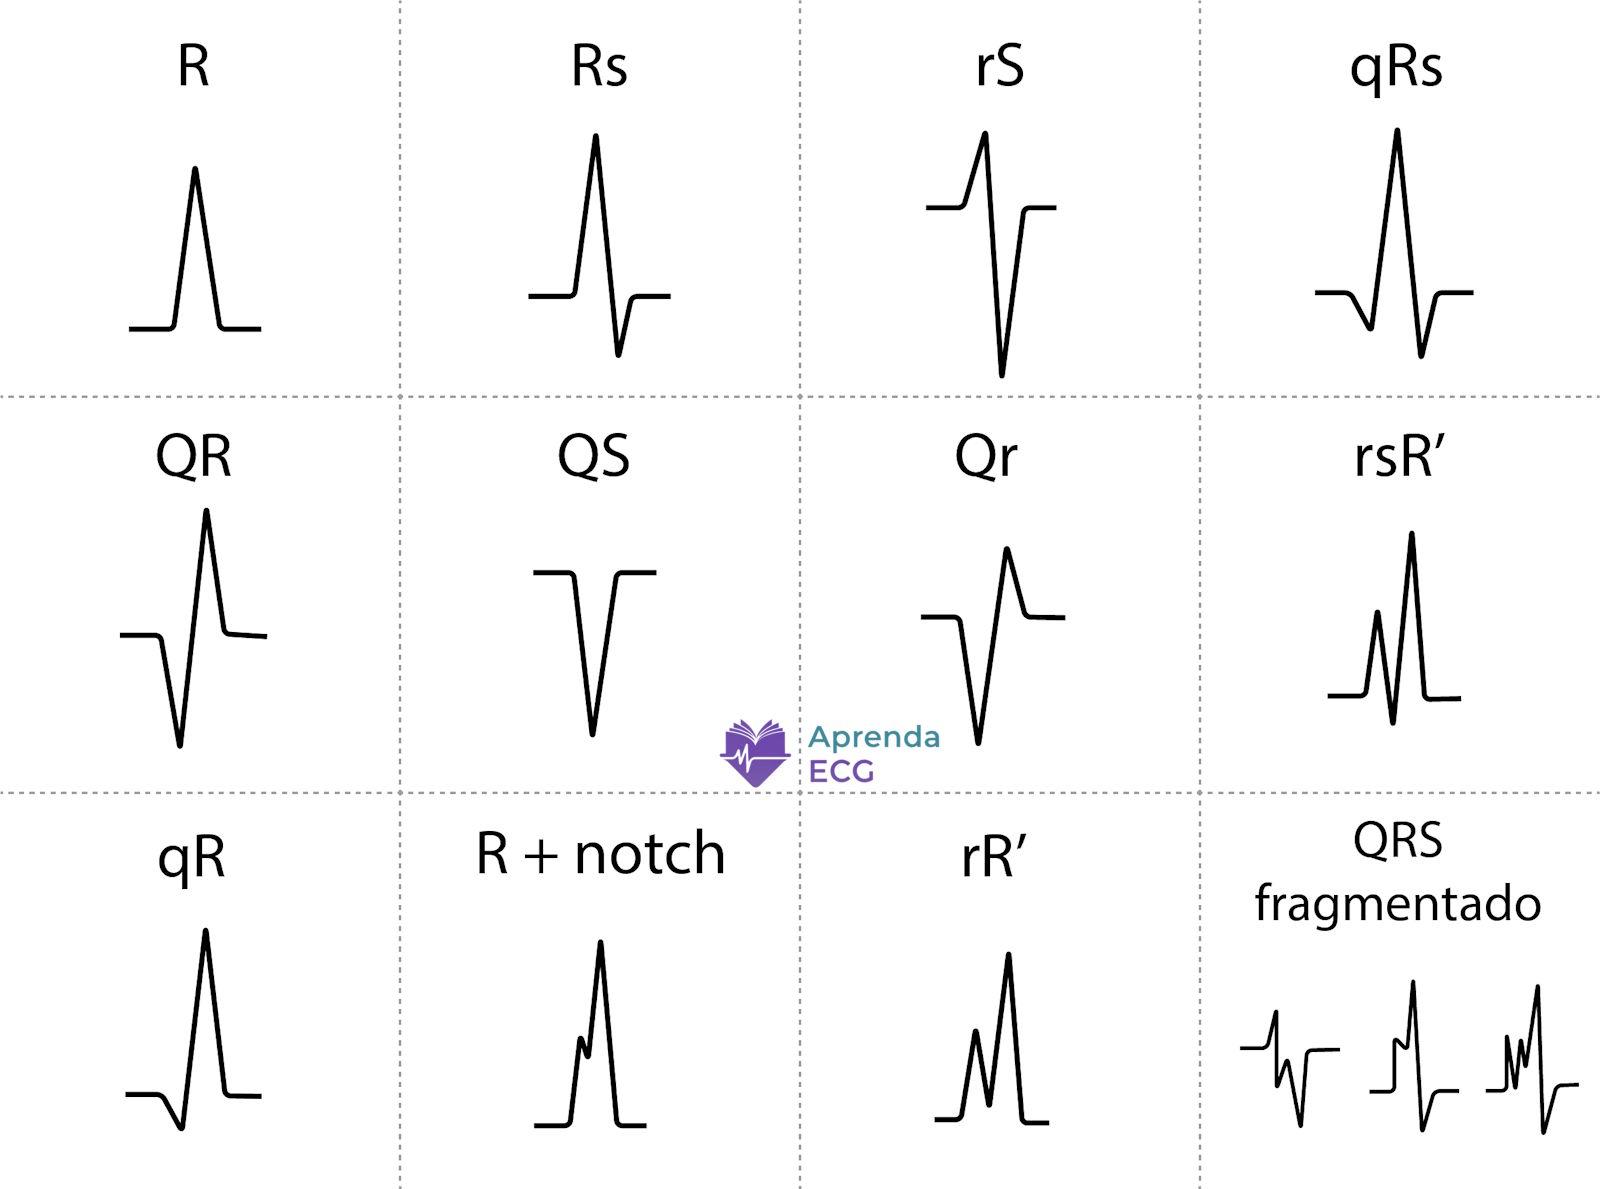
QRS Complex Nomenclature
- Uppercase letters: waves ≥ 5 mm
- Lowercase letters: waves < 5 mm
Examples:
- qRs
- rSr’
- RS
- QS (entirely negative complex)
A second positive deflection after R should be labeled R’.
Normal Values
Duration
- Normal: 60-100 ms
- Borderline: 100-119 ms
- Wide: ≥ 120 ms
Electrical Axis
- Normal: approximately between −30° and +90° in the frontal plane
R-Wave Progression
- Progressive growth from V1 to V4
- Usual transition in V3 or V4
QRS Complex Abnormalities
1. Duration Abnormalities
QRS widening indicates delayed intraventricular conduction.
Main causes:
A wide QRS should always be interpreted within the clinical context and the specific morphological pattern.
2. Amplitude Abnormalities
QRS amplitude mainly reflects ventricular mass and the transmission of the electrical signal.
Increased amplitude
Definition:
- QRS < 5 mm in all limb leads
- QRS < 10 mm in all precordial leads
May be associated with:
- Infiltrative cardiomyopathies
- Pericardial tamponade
- COPD
- Obesity
- Prior infarction
Low voltage may reduce the sensitivity of ventricular hypertrophy criteria.
3. Electrical Axis Abnormalities
QRS axis deviation may be caused by:
4. Morphological Abnormalities
- Associated with myocardial fibrosis
- Should be analyzed in contiguous leads
- Presence of multiple notches
- May occur with a narrow or wide QRS
- Associated with fibrosis, scar, and conduction heterogeneity
5. Abnormal R-Wave Progression in the Horizontal Plane
Poor R-Wave Progression
- Absence of progressive growth from V1 to V4
- Small r wave in V3
- May be due to:
- Old anterior infarction
- Left anterior fascicular block
- Left ventricular hypertrophy
- Normal variant (clockwise rotation)
On its own, its association with anterior infarction is limited.
Tall R Wave in V1 and V2
- R/S ratio > 1 in V1 or V2
- May represent:
- Electrically inactive areas in the lateral wall (Q-wave equivalent)
- Right bundle branch block
- Right ventricular hypertrophy
- Hypertrophic cardiomyopathy
- Ventricular preexcitation
- Dextrocardia
- Lead misplacement
- Normal variant
Interpretation depends on the combined analysis of QRS duration, electrical axis, and associated changes.
References
- Scheffer MK, Ohe LN, Alencar Neto JN de. Manual Prático de Eletrocardiograma do Setor de Emergências do Instituto Dante Pazzanese de Cardiologia . São Paulo: Editora dos Editores; 2022.
- Alencar Neto JN de. Tratado de ECG . Salvador: Sanar; 2022.
- Samesima N, God EG, Kruse JCL, Leal MG, et al. Diretriz da Sociedade Brasileira de Cardiologia sobre a Análise e Emissão de Laudos Eletrocardiográficos – 2022 . Arq Bras Cardiol. 2022;119(4):638-680.
- Thygesen K, Alpert JS, Jaffe AS, Chaitman BR, et al. Fourth universal definition of myocardial infarction (2018) . Eur Heart J. 2019;40(3):237-269. doi:10.1093/eurheartj/ehy462.
- Das MK, Khan B, Jacob S, Kumar A, et al. Significance of a fragmented QRS complex versus a Q wave in patients with coronary artery disease . Circulation. 2006;113(21):2495-2501. doi:10.1161/CIRCULATIONAHA.105.595892.


