

Physiology of the P Wave
The cardiac cycle begins with atrial excitation, which can be seen on the electrocardiogram as the P wave. The mitral and tricuspid valves are already open, because ventricular pressure is lower than atrial pressure and rapid filling has already occurred; that is, blood coming from the inferior and superior venae cavae filled the atrium while the ventricle was ejecting blood
The P Wave on the Electrocardiogram
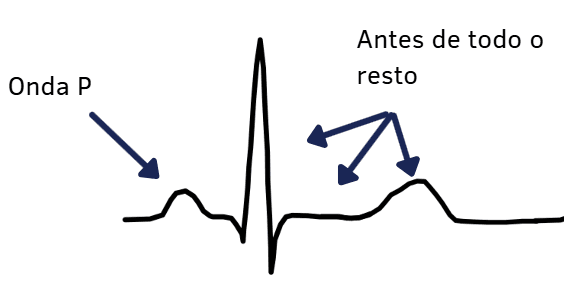
- The P wave is the first positive deflection seen on the electrocardiogram;
- Atrial depolarization begins in the outermost portion of the right atrium and spreads through the anterior wall and the interatrial septum;
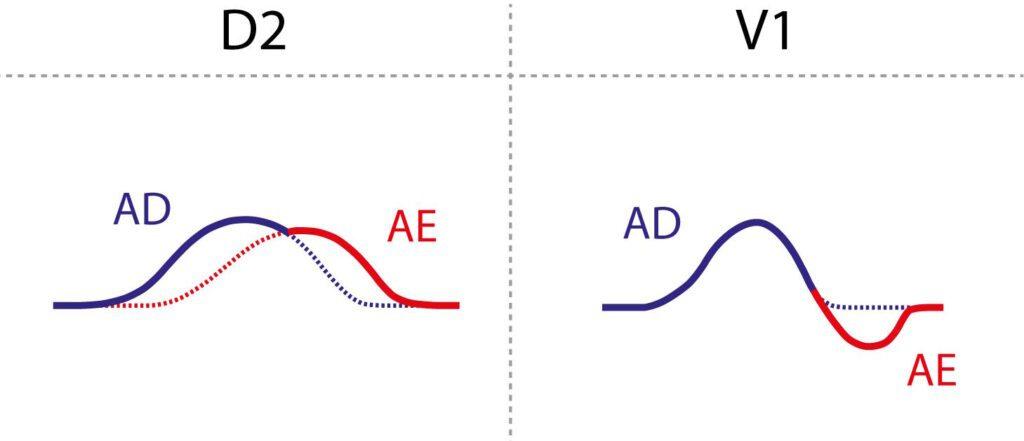
- Then, simultaneously, depolarization reaches the left atrium through Bachmann's bundle, whose function is to activate the anterior and posterior walls of the left atrium. Because of this “slight delay” between the depolarization of the two atria, right atrial depolarization is represented by the initial portion of the P wave and left atrial depolarization by the terminal portion of the P wave;
- Atrial repolarization cannot be seen on the electrocardiogram for two reasons: first, atrial repolarization has low voltage and long duration; second, this wave occurs simultaneously with the QRS complex, which hides it.
How to analyze the P wave in sinus rhythm
The essential first step in P-wave analysis is to check whether it is visible on the tracing. P waves should be present in all leads. It is important to check whether the P wave lies next to the T wave when the PR interval is prolonged or in cases of atrioventricular dissociation.
In normal sinus rhythm:
- The resulting P-wave axis in the frontal plane lies, on average, between –30° and +90°; therefore, it is usually positive in leads I, II, and aVF;
- Its duration is less than 120 milliseconds, and its amplitude is less than 2.5 mm in the frontal plane leads and less than 1.5 mm in V1 and V2.
- In the horizontal plane, the P wave in V1 is biphasic, which can be called plus-minus;
- A fully positive P wave in V1 is not expected; it may suggest an ectopic atrial rhythm, usually with a left atrial focus.
The Morris Index
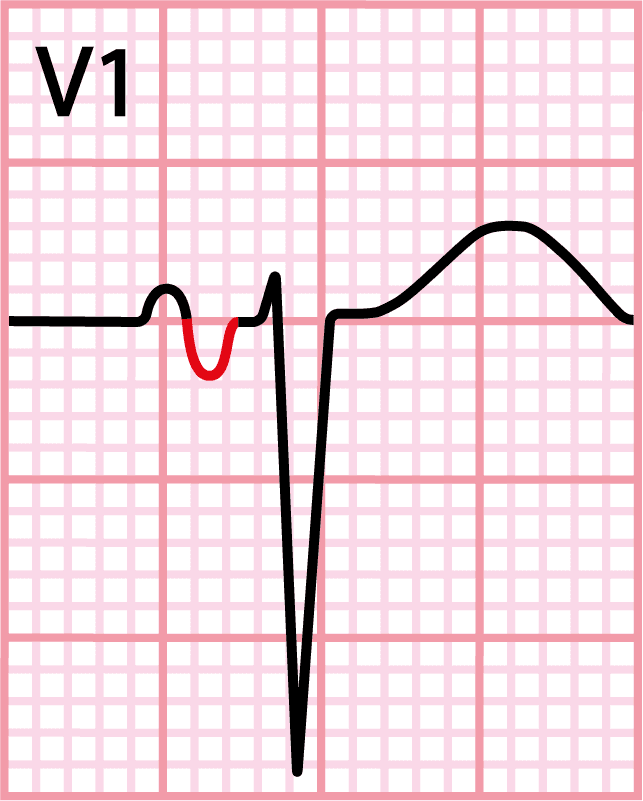
The Morris index is defined as a negative P-wave portion in V1 ≥ 40 ms in duration and ≥ 1 mm in amplitude, and it indicates left atrial enlargement.
Note that, for this criterion to work, the V1 electrode must be correctly placed in the fourth intercostal space and not in the second. The minus portion of this plus-minus wave becomes enlarged because the left atrium is posterior to the right atrium: when the impulse passes into Bachmann's bundle and there is more atrial mass, the vector increases in magnitude, producing this enlarged minus component.
Its positive likelihood ratio is 9.82, while its negative likelihood ratio is 0.33. This shows great power when the sign is present, since it increases almost 10-fold the odds that the patient has some left atrial abnormality.
Remember that a P wave > 120 ms in leads II, III, and aVF does not mean left atrial enlargement. This electrocardiographic finding is a sign called Interatrial Block (IAB).
Right Atrial Enlargement
Leads II, V1, and V2 are good for detecting right atrial abnormalities. In V1, right atrial myocardial changes affect the first half of the P wave, increasing its amplitude. The QRS complex, in turn, may show indirect changes.
Criteria for right atrial enlargement include:
- P wave > 2.5 mm in leads II, III, and aVF;
- Positive portion of the P wave > 1.5 mm in V1 and V2;
- QR or qR complexes in V1 (Sodi-Pallares sign);
- Low-amplitude QRS in V1 < 4 mm, with a > 5-fold amplitude increase from V1 to V2 (Peñaloza-Tranchesi-Reeves sign).
P pulmonale may be a good indicator suggesting lung diseases such as asthma and chronic obstructive pulmonary disease (COPD).
ECG Waves and Intervals
- P wave
- PR interval and segment
- QRS complex
- ST segment
- T wave
- QT interval
- U wave
- J wave
- Delta wave
- Epsilon wave
References
- Scheffer MK, De Marchi MFN, de Alencar Neto JN, Felicioni SP. Eletrocardiograma de A a Z. São Paulo: Manole, 2024.
- Scheffer MK, Ohe LN, de Alencar Neto JN. Manual Prático de eletrocardiograma. 2022.
- Alencar JN. Tratado de ECG. 2022.


