

The T wave on the ECG represents ventricular repolarization. It looks simple, and that is exactly why it is often misinterpreted.
Unlike the QRS complex, which reflects a relatively uniform and fast electrical phenomenon, ventricular repolarization is heterogeneous, dynamic, and highly dependent on the myocardial action potential. T-wave morphology therefore carries real pathophysiological information.
This article organizes T-wave analysis systematically, starting with the fundamental distinction between primary and secondary changes and moving through the main clinical morphologies.
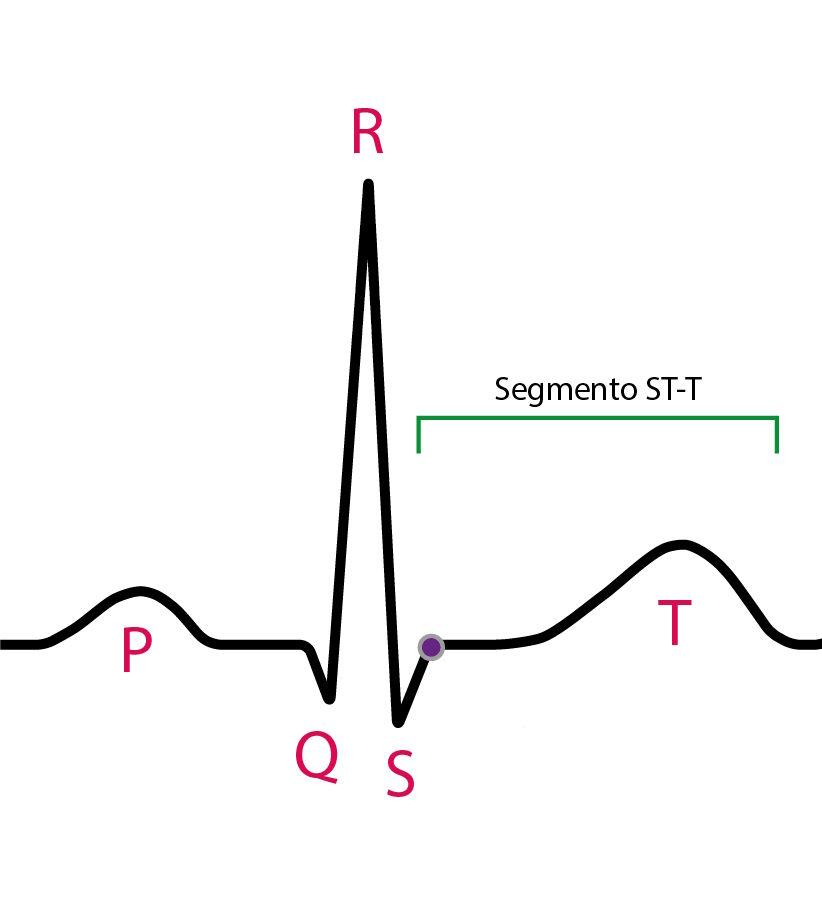
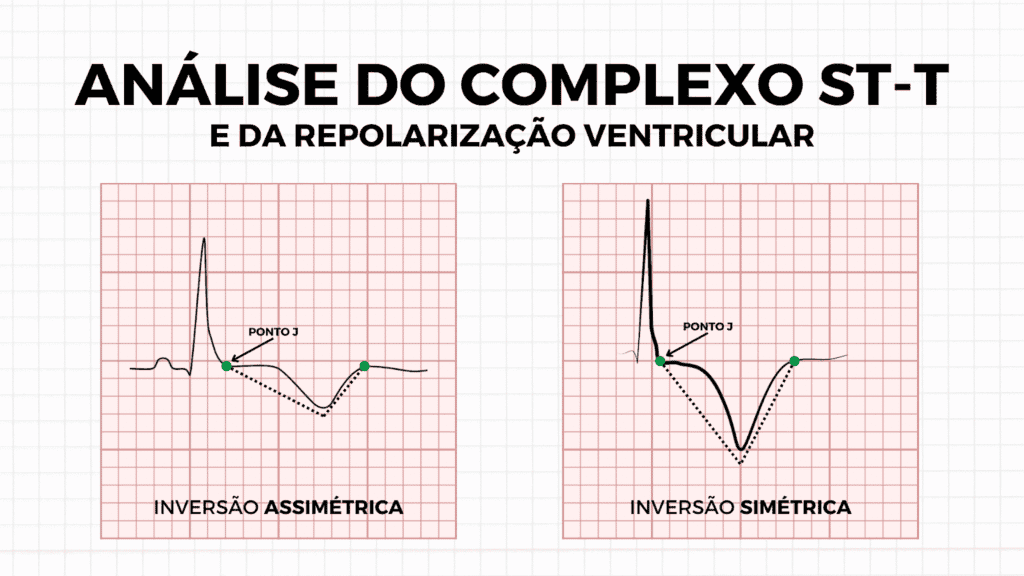
Primary and secondary T-wave changes
Before discussing any specific morphology, the conceptual basis must be established.
Classifying repolarization changes as primary or secondary is not semantics. It is pathophysiology.
Primary changes
These result from a direct modification of the ventricular action potential.
In other words, the shape and/or duration of phases 2 and 3 of the action potential have changed. Repolarization changed because the cell changed.
- Tendency toward T-wave symmetry
- Broad base
- Change in QT duration (shortening or prolongation)
- Concordance or discordance not dependent on the preceding QRS
Classic examples:
- Myocardial ischemia
- Hyperkalemia
- Pericarditis
- Channelopathies
Secondary changes
Here, repolarization is altered because depolarization was altered first.
- Asymmetric T wave
- Predictable discordance with the QRS
- QT usually preserved
- Direct spatial relationship with QRS polarity
- Bundle branch block
- Ventricular hypertrophy with strain pattern
- Pre-excitation
Normal T wave
- Asymmetric (slow upstroke, faster downstroke)
- Concordant with the QRS in most leads
- Amplitude usually < 5 mm in limb leads and < 10 mm in precordial leads
- Largest in V2–V4
- Negative in aVR
The normal T wave is not symmetric. Excessive symmetry should raise attention.
Hyperacute T wave
The hyperacute T wave is the earliest electrocardiographic manifestation of acute coronary occlusion.
It is a primary change.
- Increased amplitude
- Broad base
- Increased symmetry
- Disproportionate relationship to the QRS
The modern concept goes beyond amplitude alone. The study by Meyers et al. showed that the central feature of the hyperacute T wave is an increased magnitude of T-wave area relative to QRS amplitude, together with increased symmetry.
It represents shortening of the epicardial action potential with increased transmural dispersion.
The T wave of hyperkalemia
This is also a primary change.
- Peaked
- Narrow base
- Symmetric
- Shortened QT
In hyperkalemia, phase 3 of the action potential is accelerated by increased IKr conductance.
Biphasic T wave (plus-minus)
- Initial positive component
- Terminal negative component
It indicates a transition in the repolarization gradient and may be associated with subacute ischemia or dynamic reperfusion phenomena.
Negative T wave
T-wave negativity should be analyzed along two axes:
- Is it primary or secondary?
- Is it symmetric or asymmetric?
Primary negative T wave
- Symmetric
- Broad base
- May be associated with QT changes
Secondary negative T wave
- Asymmetric
- Discordant with the QRS
- QT usually normal
It can occur in hypertrophic cardiomyopathy, bundle branch blocks, and ventricular hypertrophy patterns.
References
- De Alencar JN, Matos VFA, Scheffer MK, et al. ST segment and T wave abnormalities: A narrative review. J Electrocardiol. 2024;85:7-15.
- Meyers HP, Simančík F, Herman R, et al. Hyperacute T Waves Are Specific for Occlusion Myocardial Infarction, Even Without Diagnostic ST-Segment Elevation. JACC Adv. 2025;4(10):102120.


