Ventricular repolarization is one of the most important and complex topics in cardiology. On the ECG, it is represented by the ST segment and the T wave, the “ST-T complex”.
By analyzing repolarization, we can identify a wide range of conditions, from cardiac emergencies to electrolyte disorders and genetic syndromes. Given the importance of the topic, and before diving into the interpretation of the ST-T complex, let’s review the basic principles of its physiology and how to measure ventricular repolarization on the ECG.
Understanding Ventricular Repolarization
Ventricular repolarization is the process by which cardiac cells restore their electrical balance after depolarization. This happens through ion movement: potassium ions (K+) leave the cells, while the entry of sodium (Na+) and calcium (Ca2+) is blocked. This ebb and flow of charged particles restores the cells’ membrane potential, leaving them ready for the next cycle.
On the ECG, the ST-T complex results from the difference in timing with which the various layers of the heart muscle repolarize. Because the outer layer (epicardium) repolarizes before the inner layer (endocardium), this time difference creates a flow of electrical current that is picked up by the electrodes, forming the ST-T complex on the tracing.
How to Measure the ST-T Complex Correctly
Contrary to what many people think, analysis of the T wave does not begin at its visible deflection, but at the J point, which marks the end of the QRS complex and the beginning of the ST segment. This detail is essential, because ventricular repolarization must be understood as a single, continuous event in which the ST segment and the T wave are inseparable parts. For this reason, the nomenclature we recommend is to refer to the ST-T complex, rather than to each element separately.
Another important point is that assessment of T-wave symmetry, an essential criterion for distinguishing primary repolarization abnormalities (such as those caused by ischemia or electrolyte disorders) from secondary abnormalities (such as those seen in bundle branch blocks or ventricular hypertrophy), should always start from the J point. In this way, the T wave is analyzed within the whole context of the ST-T complex, respecting the physiological continuity of the electrical phenomenon.
Another relevant technical aspect is defining the end of the T wave, which can be established by drawing a tangent from the nadir of its descending portion to its intersection with the baseline. This method allows an objective definition of the limits of repolarization and helps standardize ECG analysis. When this approach is applied, it becomes clear that symmetric T waves within the ST-T complex are generally associated with primary disorders, whereas asymmetric waves are typical of secondary abnormalities resulting from a previously abnormal QRS.
Therefore, understanding repolarization as an integrated ST-T complex not only ensures greater technical accuracy in reading the ECG, but also lays the foundation for a safer clinical interpretation. This approach avoids common errors in medical practice and reinforces that there is no “ST segment” dissociated from a “T wave”, but rather a continuum that fully describes the process of ventricular repolarization.
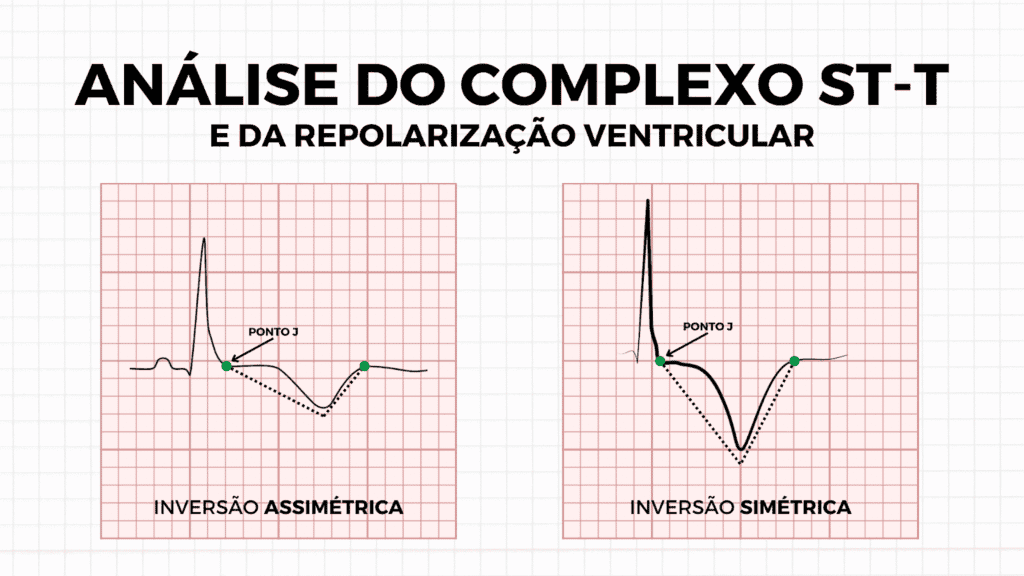
It is also important to recognize that the ST-T complex can be abnormal in different ways. These changes are not limited to T-wave inversion; they can also occur when the complex is positive. In primary repolarization disorders, for example, ST-segment elevation or a hyperacute T wave may be seen, both characterized by symmetry of the complex. In secondary disorders, on the other hand, ST elevation may also be present, but in this case it usually shows a typically asymmetric pattern, reflecting the influence of abnormal ventricular depolarization.
Therefore, whether the pattern is positive or negative, assessing symmetry and clinical context is what allows us to distinguish between primary and secondary disorders of ventricular repolarization.
Interpreting Ventricular Repolarization

Primary Repolarization Abnormalities
Primary ventricular repolarization abnormalities are caused by direct and uniform changes in the action potential of cardiac cells. These abnormalities are predominantly electrical in origin and may be triggered by several factors, such as ischemia, certain medications, electrolyte imbalances (sodium, potassium, calcium, etc.), or genetic diseases known as channelopathies. Here are the most common examples of primary ventricular repolarization abnormalities:
- Acute Coronary Occlusion (OMI): The first ECG manifestation of acute coronary occlusion is the hyperacute T wave, which has the following features: large amplitude, broad base, and symmetry. As the condition evolves, this repolarization change progresses to the classic ST-segment elevation, a crucial sign of myocardial ischemia and one of the main findings of acute infarction.
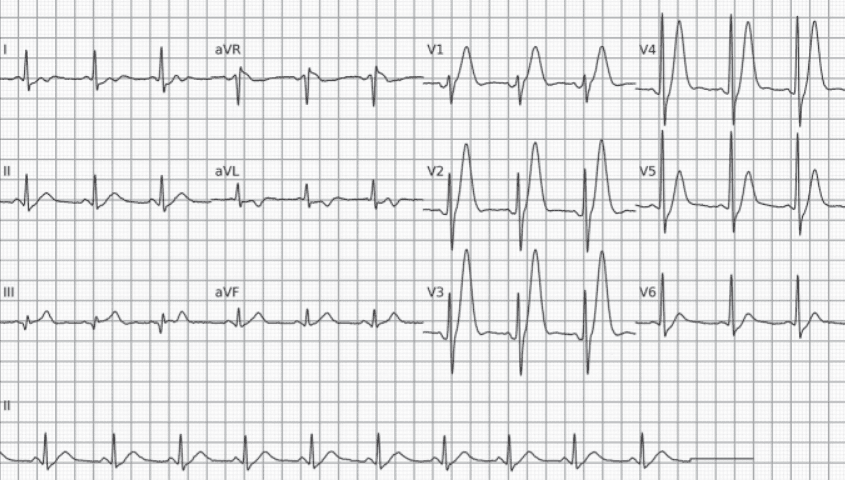
- Electrolyte Disorders: For example, in hyperkalemia this change appears as a peaked, symmetric, narrow-based T wave, often described as a “tented T wave”. We often refer to the T wave of hyperkalemia as symmetric “in itself”, because we consider only the T wave (from its virtual, nonspecific onset) rather than the ST-T complex.
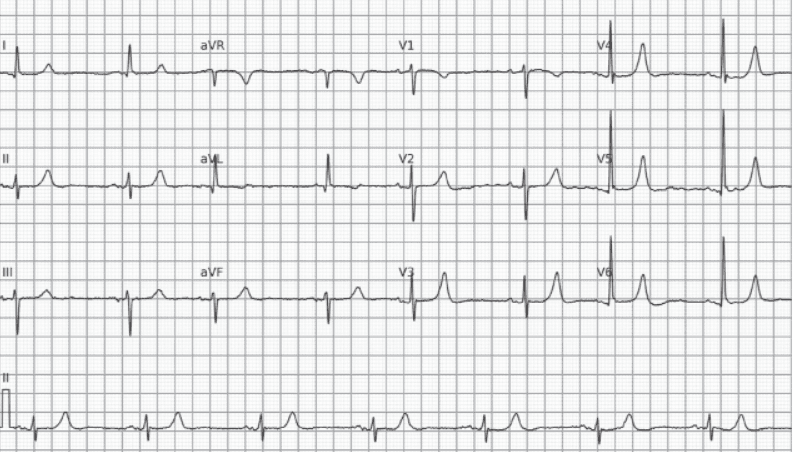
- Inflammation: For example, in pericarditis ST-T changes tend to be diffuse, that is, they appear in almost all leads rather than in a specific territory, as in OMI. The main finding is ST-segment elevation, which usually does not exceed 5 mm and may be accompanied by a more symmetric T wave. ST-segment depression in leads aVR and V1 is also common, due to their position opposite the heart’s electrical axis.
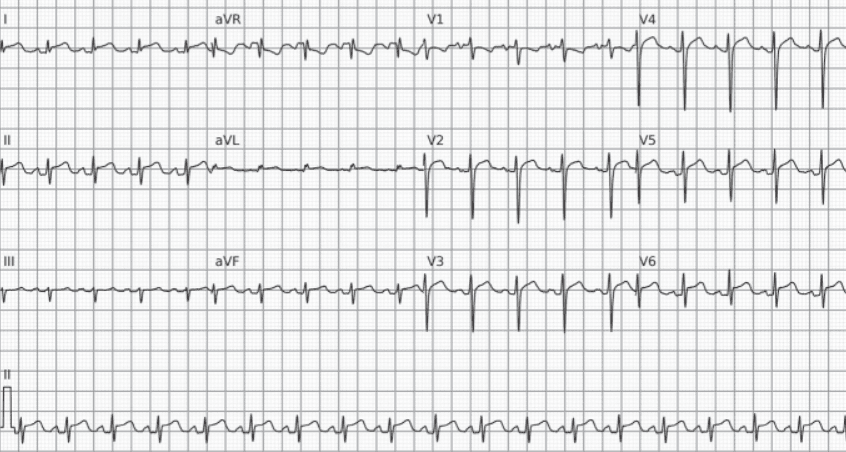
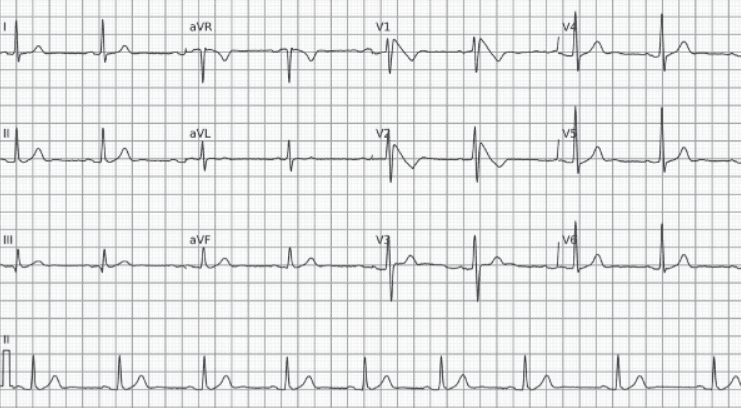
- Channelopathies: For example, Brugada syndrome is diagnosed by a specific ECG pattern. Its main feature is ST-segment elevation of 2 mm or more in leads V1 and/or V2, which may appear spontaneously or after the use of sodium channel–blocking drugs.
Secondary Repolarization Abnormalities
Secondary ventricular repolarization abnormalities are those that do not arise from a direct problem in the repolarization process, but rather as a consequence of ventricular depolarization or of ventricular contractile or geometric changes. The main feature defining these abnormalities on the electrocardiogram is T-wave asymmetry.
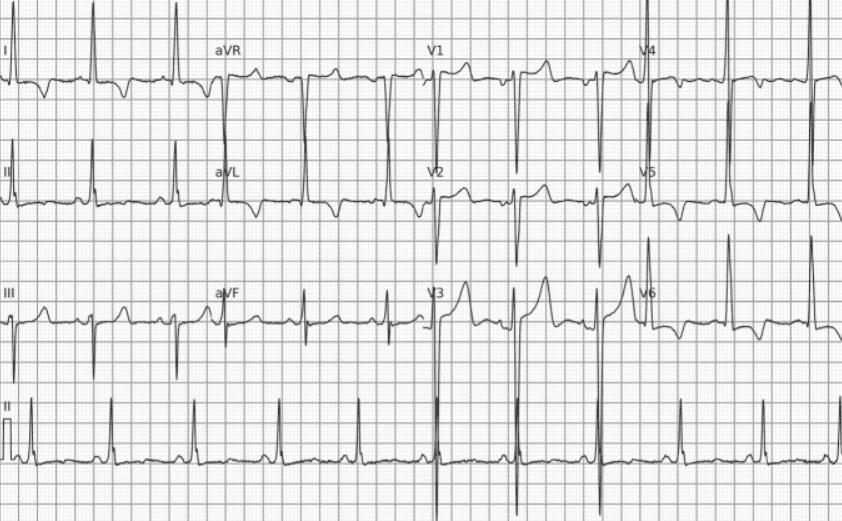
- Ventricular Hypertrophy: As a consequence of depolarization affected by probable hypertrophy of the heart muscle, the ST-T complex may be altered in different ways. A practical example is the strain pattern caused by left ventricular hypertrophy. This pattern often presents with T-wave inversion and ST-segment depression, and tends to progress as ventricular hypertrophy advances.
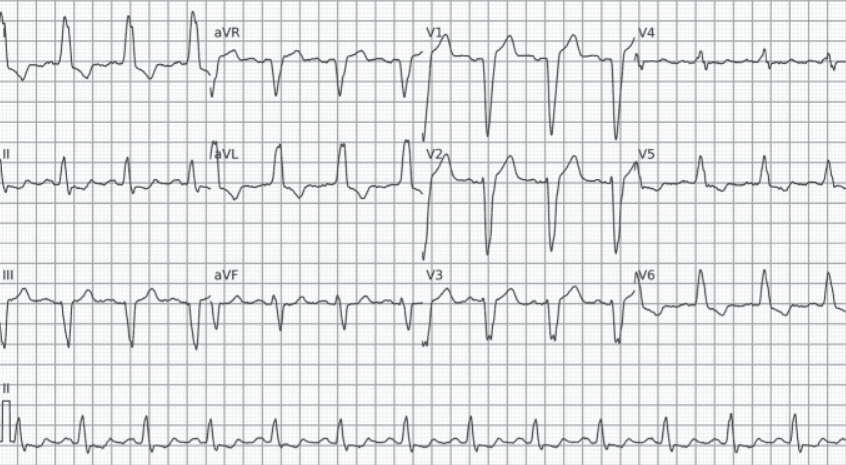
- Bundle Branch Blocks: In these cases, the ST-T complex is deviated in the direction opposite to the main deflection of the QRS complex. ST-segment elevation may be mistaken for ischemic changes.
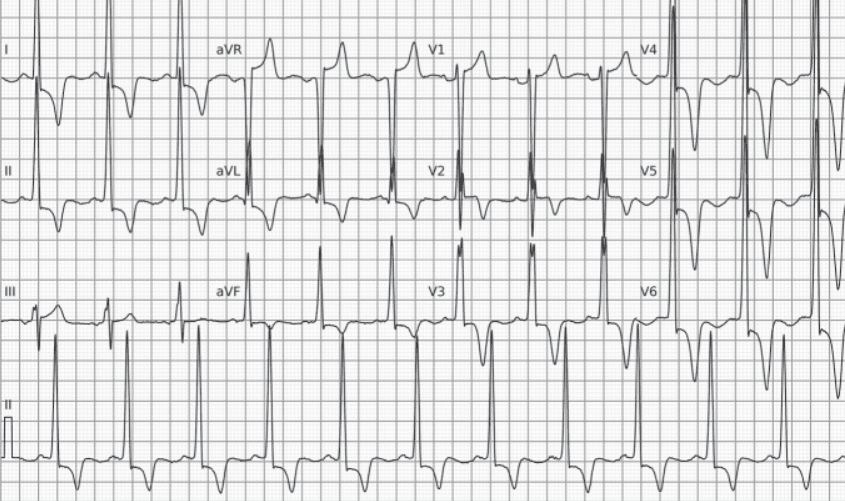
- Genetic Cardiomyopathies: For example, hypertrophic cardiomyopathy causes ventricular repolarization abnormalities due to increased muscle mass and myocardial fibrosis. On the ECG, this typically appears as a negative, asymmetric T wave. A specific variant, apical hypertrophic cardiomyopathy (Yamaguchi syndrome), shows an even more striking pattern: about half of cases display giant T-wave inversion in the precordial leads, with an amplitude greater than 10 mm.
References
- Scheffer MK, De Marchi MFN, de Alencar Neto JN, Felicioni SP. Eletrocardiograma de A a Z. São Paulo: Manole, 2024.
- de Alencar, J. N., de Andrade Matos, V. F., Scheffer, M. K., Felicioni, S. P., De Marchi, M. F. N., & Martínez-Sellés, M. (2024). ST segment and T wave abnormalities: A narrative review. Journal of electrocardiology, 85, 7–15.
- This article also benefited from the valuable contribution of Bernardo Augusto Silveira Corrêa.