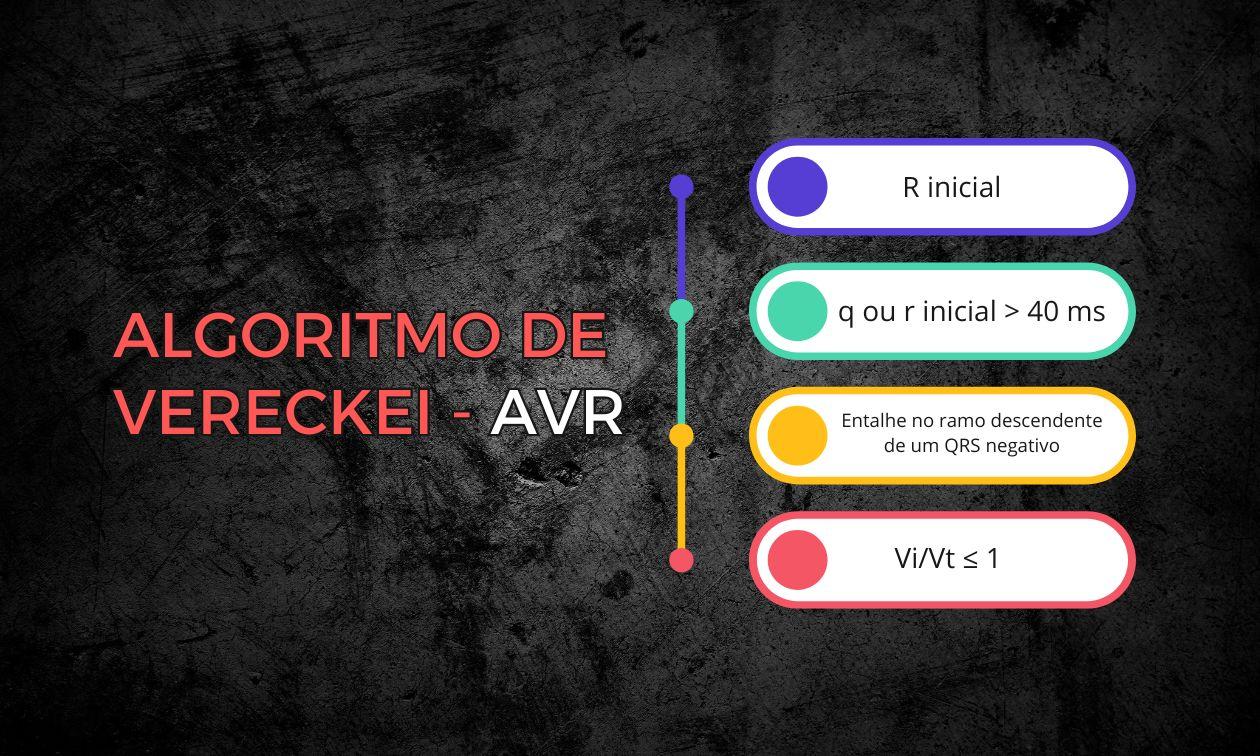
This electrocardiogram (ECG) sends chills down the spine of everyone in the emergency department: a wide QRS tachycardia. Your first instinct is probably to rush to apply the classic criteria, whether Brugada, Santos, Vereckei, or Pava.
What does Pedro Brugada have in common with a wide QRS tachycardia? Well, he has the most famous criterion. In the emergency department, faced with a probable ventricular tachycardia (VT), we often apply the Brugada algorithm. But there is a fundamental error in that sentence. Can you tell what it is?
The setting: a patient in the emergency department.
In their original study, the Brugada criteria were not tested in emergency settings, but in controlled electrophysiology centers. So what is the problem? Spectrum bias.
This bias occurs when a diagnostic test is validated in a population (spectrum) that does not adequately represent the patients in whom the test will be used in real life. Basically, the Brugada criteria were validated in a “clean” outpatient environment, while you are trying to apply them in the “war zone” of the resus room.
To understand it better, consider the following medical analogy:
Validating the Brugada criteria this way is like testing the accuracy of D-dimer only in healthy young people and marathon runners. In that group, the test would be fantastic. But if you tried to apply the same validation in an ICU full of postoperative, elderly, and cancer patients, the test would be positive in almost everyone and would completely lose its usefulness. The “spectrum” of patients changed, and the test failed.
This problem is chronic in tachycardias. By ignoring the real prevalence of VT and the condition of the unstable patient, the blind use of algorithms becomes a guessing game that can delay the diagnosis. And in VT, delay is not an option.
The original study (1991): the illusion of perfection
Let's look at Brugada's original study and draw some conclusions:
- Setting: conducted in referral centers in Belgium and the Netherlands (controlled environment).
- Clinical condition: patients were not taking antiarrhythmic drugs. In the real emergency department, patients often arrive already “loaded” with drugs that widen the QRS.
- Results: 554 tachycardias were evaluated (384 VTs and 170 supraventricular tachycardias with aberrancy). Sensitivity was 98.7% and specificity 96.5%.
Looks perfect, right?
But when we leave the lab and go into real life (external validations), the story changes.
The reality check: external validations
Several studies tried to replicate this success in the emergency department and found serious problems, measured by statistics you need to know: kappa and the ROC curve.
What is kappa?
It is a measure of agreement between two observers that discounts chance. If two physicians look at the same ECG and disagree about the criteria, the method is too subjective. A low kappa (close to 0) indicates that interpretation is “chaos.”
What is the ROC curve (AUC)?
It is the test's “report card.” The area under the curve (AUC) ranges from 0.5 (coin toss / useless) to 1.0 (perfect). A good test should have an AUC above 0.8.
Here is what the studies showed:
- Isenhour (2000): sensitivity for VT 79–91%, specificity 43–70%. Moderate interobserver agreement (kappa 0.42–0.54).
- Lau and Ng (2002): sensitivity 92–95%, specificity ~44%, overall accuracy ~75%.
- Jastrzębski (2012): sensitivity 89.0%, specificity 59.2%, accuracy 77.5%. LR+ 2.18.
- Kaiser (2015): sensitivity ~90%, very low specificity (35–36%), AUC 0.62, and negative kappa (≈ −0.09), indicating high subjectivity.
Conclusion: the math of danger
A patient older than 35 with a wide QRS tachycardia already has a pretest probability of about 80–90% of VT. If we apply a test with poor specificity and a weak negative likelihood ratio, the post-test probability barely changes.
In other words, the criterion does not help rule out VT safely and also wastes precious time. When in doubt, forget the algorithm juggling: treat it as VT.
References
- Alencar JN. Tratado de ECG. 2022.
- Neto JA. Manual de Medicina Baseada em Evidências. Salvador: Sanar; 2021.
- Brugada P, Brugada J, Mont L, Smeets J, Andries EW. A new approach to the differential diagnosis of a regular tachycardia with a wide QRS complex. Circulation. 1991 May;83(5):1649–59.
- Isenhour JL, Craig S, Gibbs M, Littmann L, Rose G, Risch R. Wide-complex tachycardia: Continued evaluation of diagnostic criteria. Academic Emergency Medicine 2000;7(7):769–73.
- LAU EW, NG GA. Comparison of the Performance of Three Diagnostic Algorithms for Regular Broad Complex Tachycardia in Practical Application. Pacing and Clinical Electrophysiology 2002;25(5):822–7.
- Jastrzebski M, Kukla P, Czarnecka D, Kawecka-Jaszcz K. Comparison of five electrocardiographic methods for differentiation of wide QRS-complex tachycardias. EP Europace 2012;14(8):1165–71.
- Kaiser E, Darrieux FCC, Barbosa SA, Grinberg R, Assis-Carmo A, Sousa JC, et al. Differential diagnosis of wide QRS tachycardias: Comparison of two electrocardiographic algorithms. Europace 2015;17(9):1422–7.