
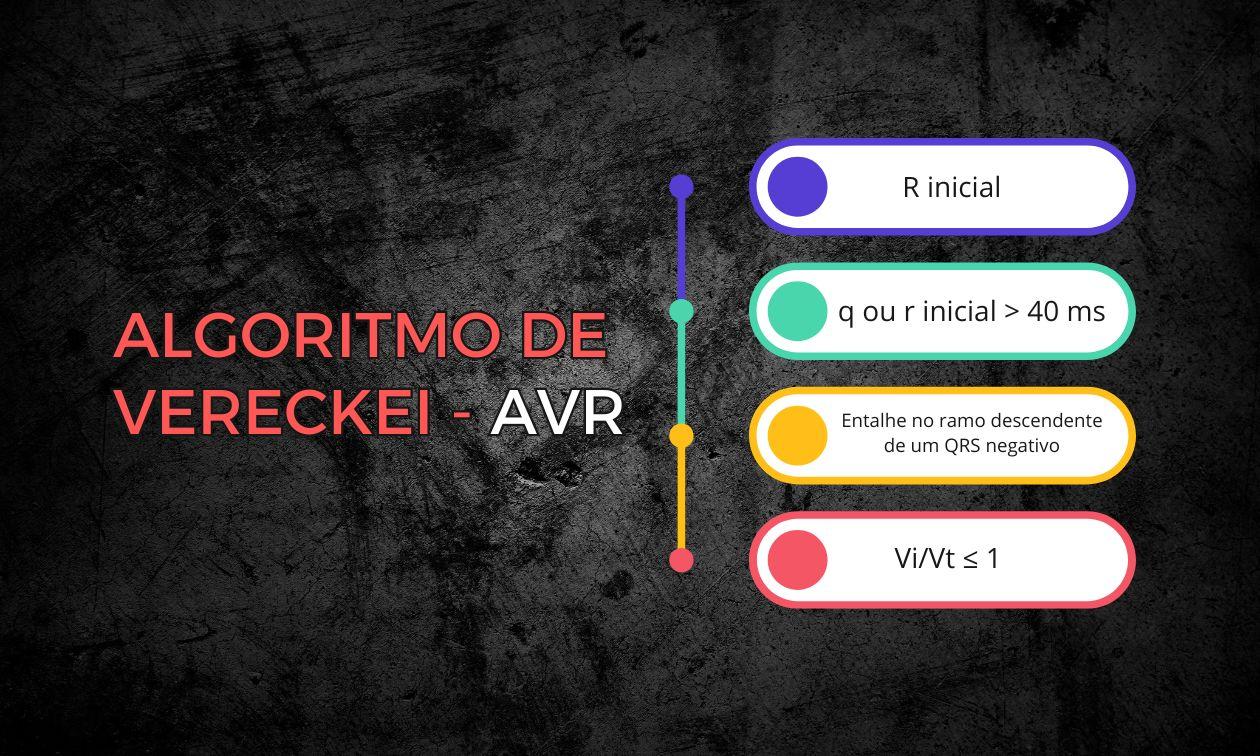
In this post, we review how to apply the algorithm step by step, with special attention to the concept of Vi/Vt, and also discuss the performance limitations observed in independent studies.
Differentiating ventricular tachycardia (VT) from supraventricular tachycardia with aberrancy (SVT-A) is one of the greatest challenges in electrocardiography. In 2008, András Vereckei and colleagues proposed a simplified algorithm based exclusively on lead aVR, with only four sequential steps.
The Vereckei Algorithm: Lead aVR
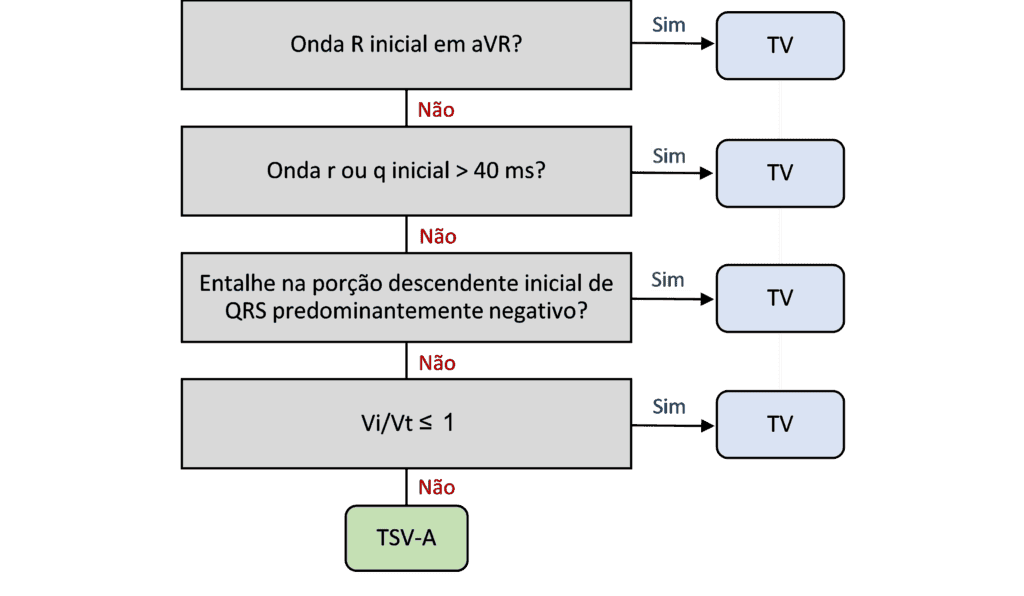
The algorithm consists of four steps applied only to lead aVR. It is enough for one of the steps to be positive to diagnose VT. If all are negative, the suggested diagnosis is SVT-A.
- Presence of an initial R wave in aVR: if there is an initial R wave (R or RS complex, but not rS), consider VT.
- r or q wave duration ≥ 40 ms: if the initial r or q wave lasts ≥ 40 ms, consider VT.
- Notch on the descending limb of a negative QRS: if there is a notch on the downstroke of a predominantly negative QRS, consider VT.
- Vi/Vt ratio: if none of the previous steps is positive, assess the Vi/Vt ratio, described below.
Understanding the Vi/Vt concept
This ratio is based on the difference in velocity between initial and terminal ventricular activation.
- Vi is the voltage change (in mV) during the first 40 ms of the QRS.
- Vt is the voltage change during the last 40 ms of the QRS.
The calculation is: Vi/Vt = (change in the initial 40 ms) / (change in the terminal 40 ms)
During VT, initial conduction is slower (muscle to muscle), producing a smaller voltage change at the beginning and a larger change at the end, when conduction speeds up. Thus:
- Vi/Vt ≤ 1 → suggests VT
- Vi/Vt > 1 → suggests SVT-A
📌 Practical note: this measurement requires attention to detail and, in some cases, magnification of the tracing for greater precision.
Algorithm performance: pay attention to the data
In Vereckei's original study, the algorithm showed:
- Sensitivity: 96.5%
- Specificity: 75%
- Accuracy: 91.5%
However, independent studies did not confirm these numbers. Jastrzebski et al. (2012) performed the first head-to-head comparison of five methods for differentiating wide QRS tachycardias (including Brugada, Griffith, and Vereckei's aVR algorithm). The results were more modest:
- Accuracy of the aVR algorithm: 71.9%
- Sensitivity: 87.1%
- Specificity: 48.0%
- Positive likelihood ratio (LR+): 1.67
- Negative likelihood ratio (LR–): 0.27
In addition, the study found that most of the algorithm's errors occurred at the Vi/Vt step, which can be difficult to apply in clinical practice without magnifying the tracings or using digital tools.
Conclusion
The Vereckei algorithm offers a quick, elegant approach based solely on aVR. However, it is essential to recognize its limitations in real-world settings and to remember that no algorithm is perfect in every context.
Learn more
👉 We have already published a detailed post on the Brugada algorithm
👉 And you can access the various algorithms for wide QRS tachycardias in our tools section.
References
- Scheffer MK, De Marchi MFN, de Alencar Neto JN, Felicioni SP. Eletrocardiograma de A a Z. São Paulo: Manole, 2024.
- Vereckei A, Duray G, Szénási G, Altemose GT, Miller JM. New algorithm using only lead aVR for differential diagnosis of wide QRS complex tachycardia. Hear Rhythm. 2008 Jan;5(1):89–98.
- Jastrzebski M, Kukla P, Czarnecka D, Kawecka-Jaszcz K. Comparison of five electrocardiographic methods for differentiation of wide QRS-complex tachycardias. EP Eur. 2012 Aug;14(8):1165–71.