

The exact calculation of the cardiac electrical axis actually has little practical importance. Recognizing axis deviation beyond the normal limits is enough for a correct, systematic analysis of the ECG.
How to Estimate the Cardiac Electrical Axis
The ventricular electrical axis is assessed using the frontal plane leads (I, II, III, aVR, aVL, aVF). The goal is to determine the direction of the mean electrical vector of ventricular depolarization.
Steps to Determine the Axis
- Analyze leads I and II:
- If both are positive, the axis is normal (between -30° and +90°).
- If I is positive and II is negative, there may be left axis deviation.
- If I is negative and II is positive, there may be right axis deviation.
- If both are negative, the deviation is extreme.
- Identify the lead with the largest QRS amplitude:
- The electrical vector points toward the lead in which the QRS complex is predominantly positive.
- If a lead is entirely negative, the axis is 180° away from that direction.
- Identify the isoelectric (equiphasic) lead:
- When a lead shows R and S waves of equal amplitude, the electrical axis is approximately perpendicular to it.
Axis analysis using leads I and II is preferred over I and aVF because lead II is perpendicular to -30º, which makes it a better indicator of left axis deviation. When lead II is negative, the axis is outside the normal range, indicating left axis deviation. In contrast, aVF can be negative even when the axis is still within the normal range (-30º to 0º), which may lead to misinterpretation if used alone. Therefore, assessing leads I and II together allows a more accurate determination of the electrical axis, better distinguishing normal cases from pathological deviations.
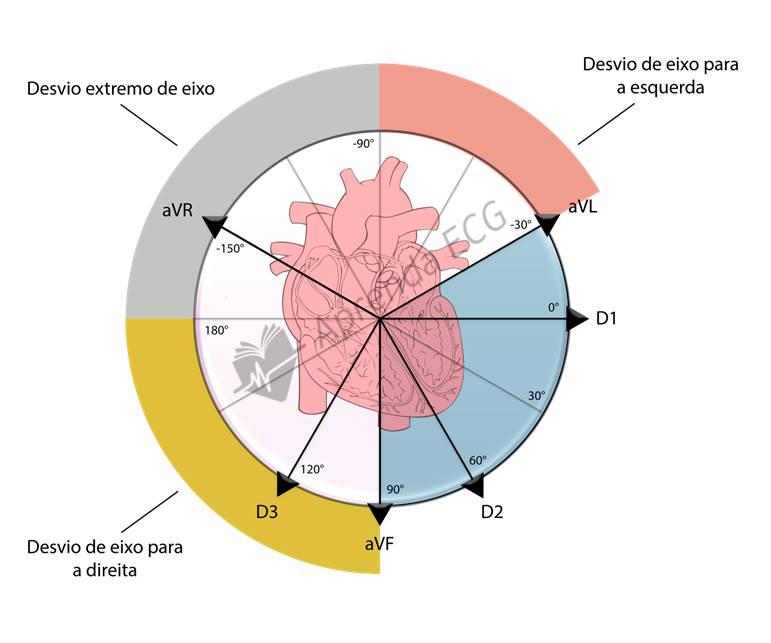
Axis Deviations and Their Limits
| Type of Deviation | Axis Range |
|---|---|
| Normal Axis | -30° to +90° |
| Left Axis Deviation | -30° to -90° |
| Right Axis Deviation | +90° to +180° |
| Extreme Axis Deviation | -90° to +180° |
Practical Importance
Determining the electrical axis is a valuable tool in ECG analysis, especially when there are signs of fascicular blocks, ventricular hypertrophy, or metabolic disturbances. Looking at leads I and II is one of the quickest and most effective steps to identify whether the axis is normal or deviated.


