

The ECG is a test that combines the complexity and beauty of cardiac physiology in a single tracing. To ensure a complete analysis without letting any detail go unnoticed, it is essential to follow a systematic approach. This approach not only makes interpretation easier but also ensures a reliable report.
Step 0 – Identify the patient
This is where the report begins. Knowing whether the patient is healthy or has conditions that may alter cardiac structure and function, and therefore the ECG, gives you more tools to analyze the ECG with an established pretest probability. In this step, we look at:
- Name
- Age
- Sex
- Underlying diseases
Step 1 – P wave
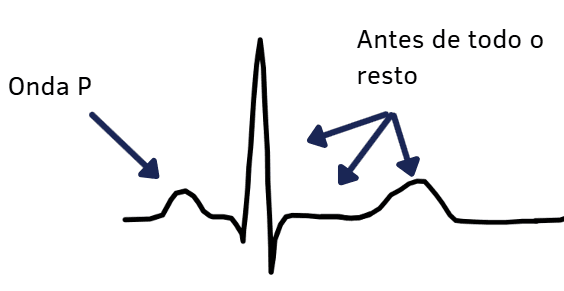
We know that the electrical activity of the heart begins in the atria. The initial impulse is fired in the sinus node, located at the junction of the superior vena cava and the right atrium. From this information, we can identify the rhythm and the amplitude and duration of the P wave.
Step 1.1: Is the rhythm sinus? What is the rate?
The sinus P wave should be:
- Positive in I, II and aVF
- Plus-minus or minus in V1
- Positive in V6
Heart rate can be measured using 3 methods:
- There should be 3 to 6 large boxes between one beat and the next
- Divide 1500 by the number of small boxes between two consecutive beats
- Multiply the number of beats within 30 large boxes by 10
Step 1.2: Is the P wave tall or wide?
Maximum duration:
- 3 mm
If the P wave is wider than that, we should think of interatrial blocks.
Maximum amplitude:
- 2.5 mm in II, III and aVF.
- 1.5 mm in the upper portion of V1 or 1.0 mm in the lower portion of V1.
If the P wave amplitude is greater than normal, we should think of atrial enlargement. If abnormal in the inferior wall (II, III and aVF), we think of right atrial enlargement; if abnormal in V1, we think of left atrial enlargement.
Did you think we reported atrial enlargement based on P-wave widening? Read the article on interatrial block here on the site.
Step 2 – PQ interval
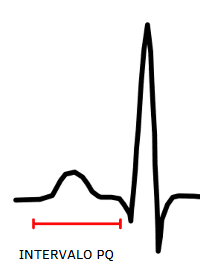
It reflects the time spanning the onset of atrial activation and ventricular activation, that is, the time the impulse takes to arise in the sinus node, activate the left and right atria and reach the atrioventricular node (AV node). We measure it from the beginning of the P wave to the beginning of the QRS complex.
Normal PQ interval duration:
- ≥ 120 ms
- ≤ 200 ms
If prolonged, we think of atrioventricular blocks. If shortened, we should look for the cause, always keeping in mind that an accessory pathway may be present.
Step 3 – QRS complex
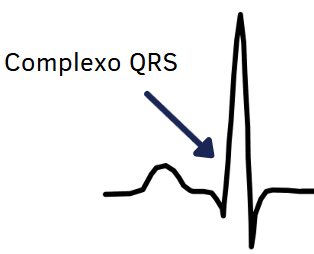
This is where ventricular activation begins. Ventricular depolarization is represented by the QRS complex. We assess the axis, QRS duration and amplitude. Axis deviations may result from lead reversals, but they can also give us clues about disease.
Step 3.1: Electrical axis
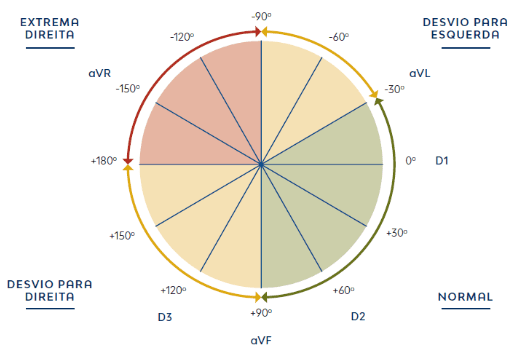
The cardiac electrical axis is normal when:
- The QRS complexes in I and II are predominantly positive.
- If negative in I, in II, or in both I and II, we think of blocks.
- Negative in I, positive in II: right axis deviation.
- Negative in II, positive in I: left axis deviation.
- Negative in I and II: possible extreme axis deviation.
Step 3.2: Duration
Normal QRS complex duration:
- ≥ 120 ms
If longer than that, think of bundle branch block.
Step 3.3: Amplitude
The V3 tip:
- If the S wave is greater than 10 to 15 mm, there may be left ventricular hypertrophy.
Step 3.4: Inactive Zones
Cardiac scars or fibrosis produce:
- Q waves, usually in leads corresponding to the walls of the heart. Don't know which walls they are? We have an article about them on the site.
- QRS fragmentation.
Step 4 – ST segment

The image above shows several examples of ST-segment elevation. With the ST segment and the T wave, we are dealing with ventricular repolarization. ST and T changes may be primary or secondary. The context and the clinical picture will tell which group they belong to.
Look for ST elevation or ST depression. ST elevation is classified as follows:
- Greater than 1 mm in all leads except V2 and V3.
- Greater than 1.5 mm in V2 and V3 (women).
- Greater than 2 mm in V2 and V3 (men ≥ 40 years).
- Greater than 2.5 mm in V2 and V3 (men < 40 years).
Countless conditions can cause ST elevation on the ECG, including infarction. Again, the presence of ST elevation does not mean the presence of infarction. Up to 60% of patients with acute coronary occlusion may not show ST elevation on the ECG. At this step, correlating ST elevation or depression with the clinical picture is mandatory.
To interpret the ST-segment findings, we move on to the next step: the T wave.
Step 5 – T wave
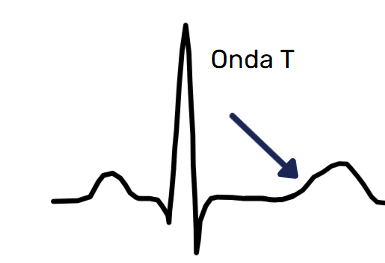
Like the ST segment, it also reflects ventricular repolarization. Changes in this wave may be primary or secondary in origin.
Morphology:
- The T wave is asymmetric, with a slower upstroke than downstroke.
- It should be positive in all leads, except:
- aVR, III and V1, where it may be negative.
- V2 and V3 in women and children, where it may also be negative.
A primary T wave is symmetric and may indicate:
- Ischemia
- Ion channel or electrolyte problems
A secondary T wave is asymmetric and may indicate:
- Abnormal depolarization
- Abnormal geometry
- Abnormal contraction
References
- de Alencar Neto JN, de Jesus Oliveira MH. ECG Passo a Passo. São Paulo, 2024.
- Scheffer MK, De Marchi MFN, de Alencar Neto JN, Felicioni SP. Eletrocardiograma de A a Z. São Paulo: Manole, 2024.
- Scheffer MK, Ohe LN, de Alencar Neto JN. Manual Prático de eletrocardiograma. 2022.
- Alencar JN. Tratado de ECG. 2022.
- This article was written with the collaboration of Gabriel Scarpioni Barbosa.


