

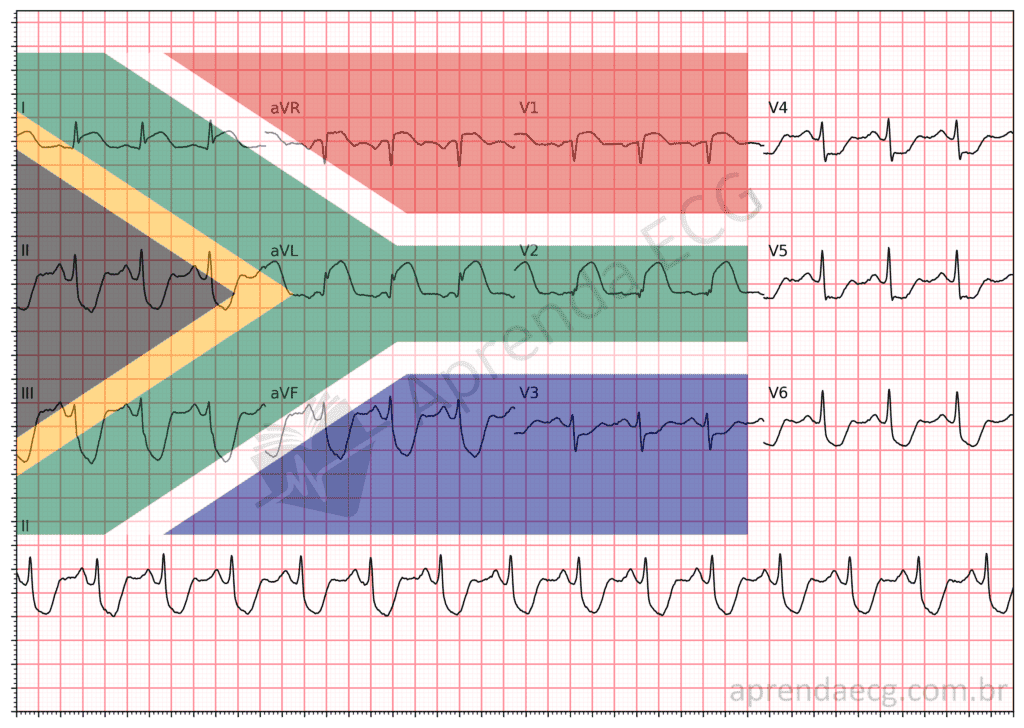
Among the most recent advances in teaching electrocardiographic patterns, the “South African flag sign” has gained prominence as an effective teaching tool for identifying mid-anterior wall infarction. To understand the relevance of this sign, it is essential to revisit the relationship between ECG leads and the affected myocardial regions, correcting some concepts that have proven imprecise over time.
The Evolution of Infarct Wall Classification
Traditionally, leads aVL and V2 were regarded as non-contiguous, representing different regions of the myocardium: aVL was associated with the high lateral wall, while V2 was linked to the anterior wall. However, with advances in cardiac magnetic resonance imaging and the new classification of infarct walls proposed by Bayés de Luna, it became clear that these leads are actually contiguous, all related to the territory of the mid-anterior wall.
This new classification clarifies that leads I, aVL and V2 correspond to a common perfusion territory, usually supplied by the first diagonal branch of the left anterior descending artery. Recognizing this continuity between the leads contributes to a more accurate diagnosis of mid-anterior wall infarction, correcting the view that these areas were unrelated.
The South African Flag Sign
This reclassification gave rise to the “South African flag sign”, which consists of the combination of ST-segment elevation in I, aVL and V2, associated with ST-segment depression in the inferior wall, most evident in lead III. The pattern of ST elevation and depression across different ECG leads resembles the layout of the green Y-shaped band on the South African flag.
This visual pattern is a clear and useful representation in the diagnosis of mid-anterior wall infarction, especially in light of the new understanding of contiguous leads.
Conclusion
Correct interpretation of electrocardiographic signs such as the “South African flag sign” can be decisive for the early diagnosis and appropriate treatment of infarction. By recognizing that leads I, aVL and V2 are contiguous and correspond to the same anatomical territory, physicians can take a more accurate approach.
References
- Scheffer MK, De Marchi MFN, de Alencar Neto JN, Felicioni SP. Eletrocardiograma de A a Z. São Paulo: Manole, 2024.
- Bayés de Luna A, Wagner G, Birnbaum Y, Nikus K, et al. A New Terminology for Left Ventricular Walls and Location of Myocardial Infarcts That Present Q Wave Based on the Standard of Cardiac Magnetic Resonance Imaging. Circulation. 2006;114(16):1755–60.
- Littmann L. South African flag sign: A teaching tool for easier ECG recognition of high lateral infarct. Am J Emerg Med. 2016;34(1):107–9.
- Rajendran G, Mahalingam S, Kagne R, Nathan B. The South African flag sign—an electrocardiographic sign to predict the culprit artery. QJM An Int J Med. 2021;114(9):665–6.