

Acute coronary occlusion (ACO), or occlusion myocardial infarction (OMI), is the most severe form of acute coronary syndrome and requires immediate recognition. Although ST-segment elevation remains the classic marker of transmural ischemia, its sensitivity for detecting OMI is limited. Recent data show a sensitivity of around 43.6%, meaning that more than half of coronary occlusions may not meet the classic STEMI criteria 3.
The traditional STEMI/NSTEMI paradigm, by basing treatment decisions predominantly on the presence or absence of ST-segment elevation, fails to capture the electrocardiographic complexity of OMI. The OMI/NOMI model proposes a more pathophysiological approach, incorporating additional high-risk ECG patterns 1,3.
This article reviews the main electrocardiographic signs of OMI, their diagnostic criteria and their clinical significance, with a practical focus for cardiologists and emergency physicians.
Electrocardiographic Signs of Acute Coronary Occlusion
1. Classic ST-Segment Elevation
ST-segment elevation is defined, according to the Fourth Universal Definition of Myocardial Infarction, as elevation ≥1 mm in two contiguous leads (with specific criteria for V2-V3), in the absence of bundle branch block or significant left ventricular hypertrophy.
Pathophysiologically, it represents transmural ischemia due to complete coronary occlusion without adequate collateral circulation. Its specificity is high, but its sensitivity is limited 3.
Clinically, it remains a formal indication for immediate reperfusion. However, it should not be interpreted as the only reliable marker of OMI.
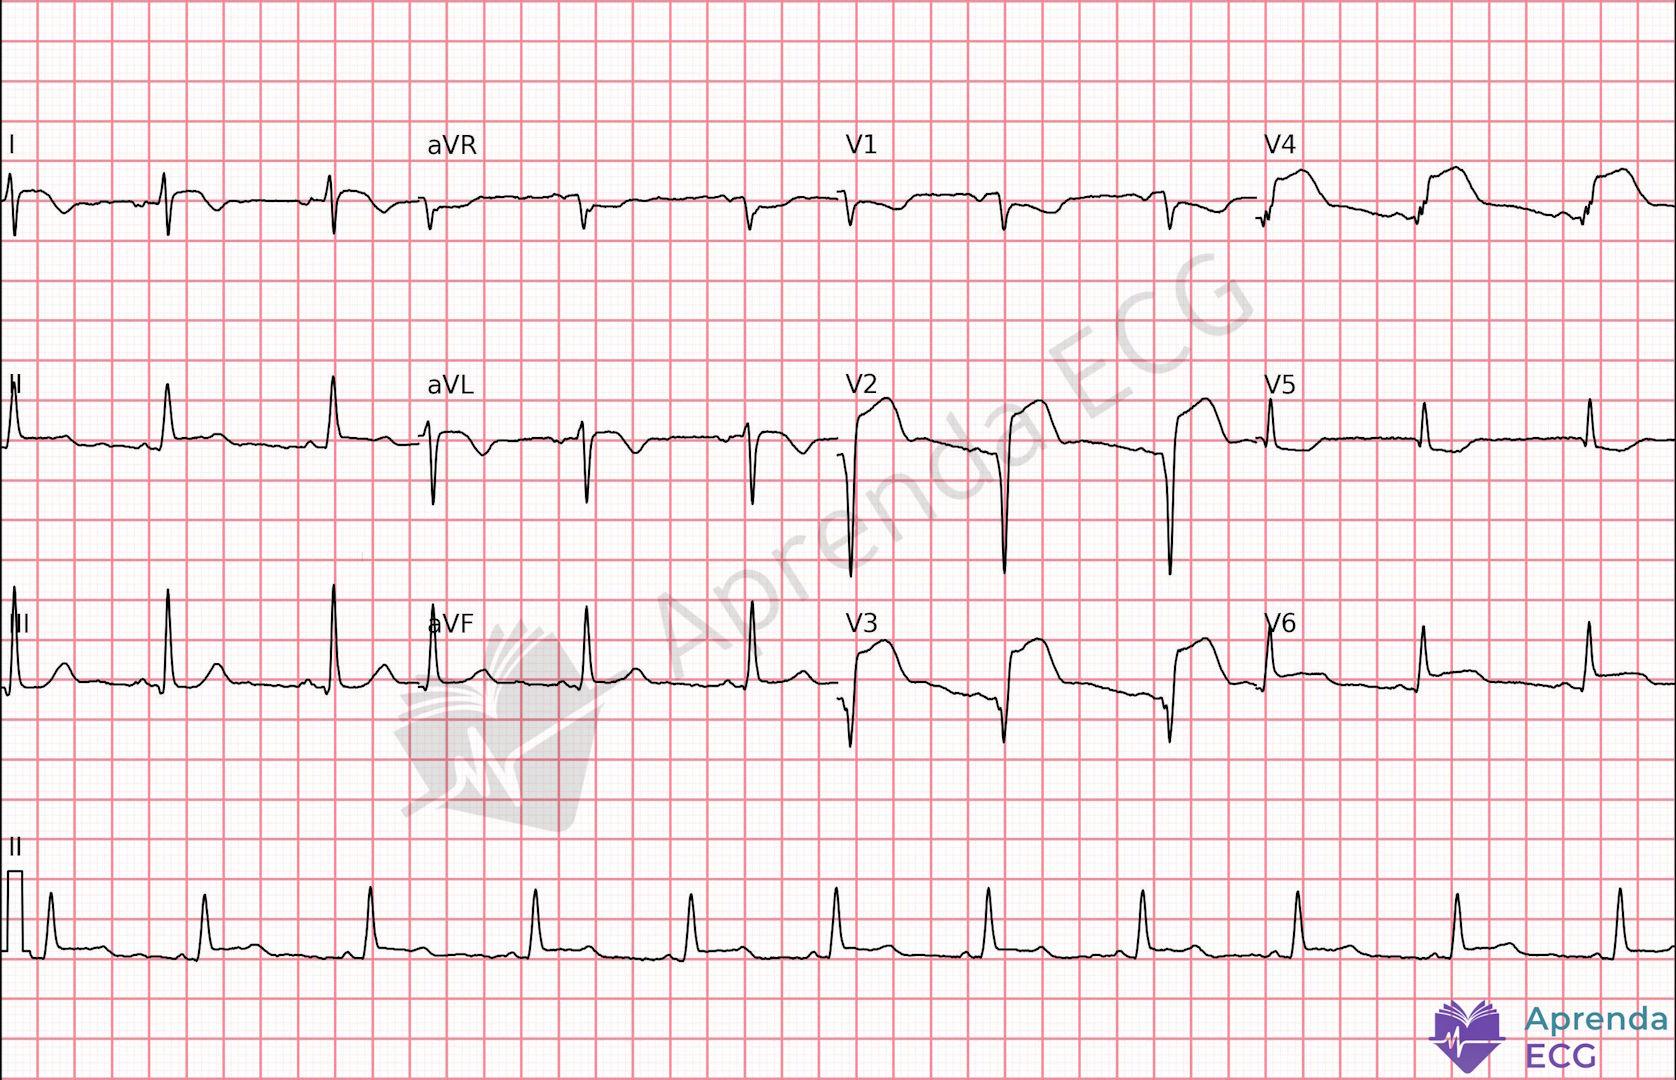
2. Subtle ST-Segment Elevation
Elevations between 0.1 and 0.9 mm often do not meet guideline criteria, but may represent true occlusion, especially when accompanied by dynamic changes or reciprocal changes 2.
Recognition requires comparison with prior ECGs, careful assessment of ST-segment morphology and close clinical correlation.
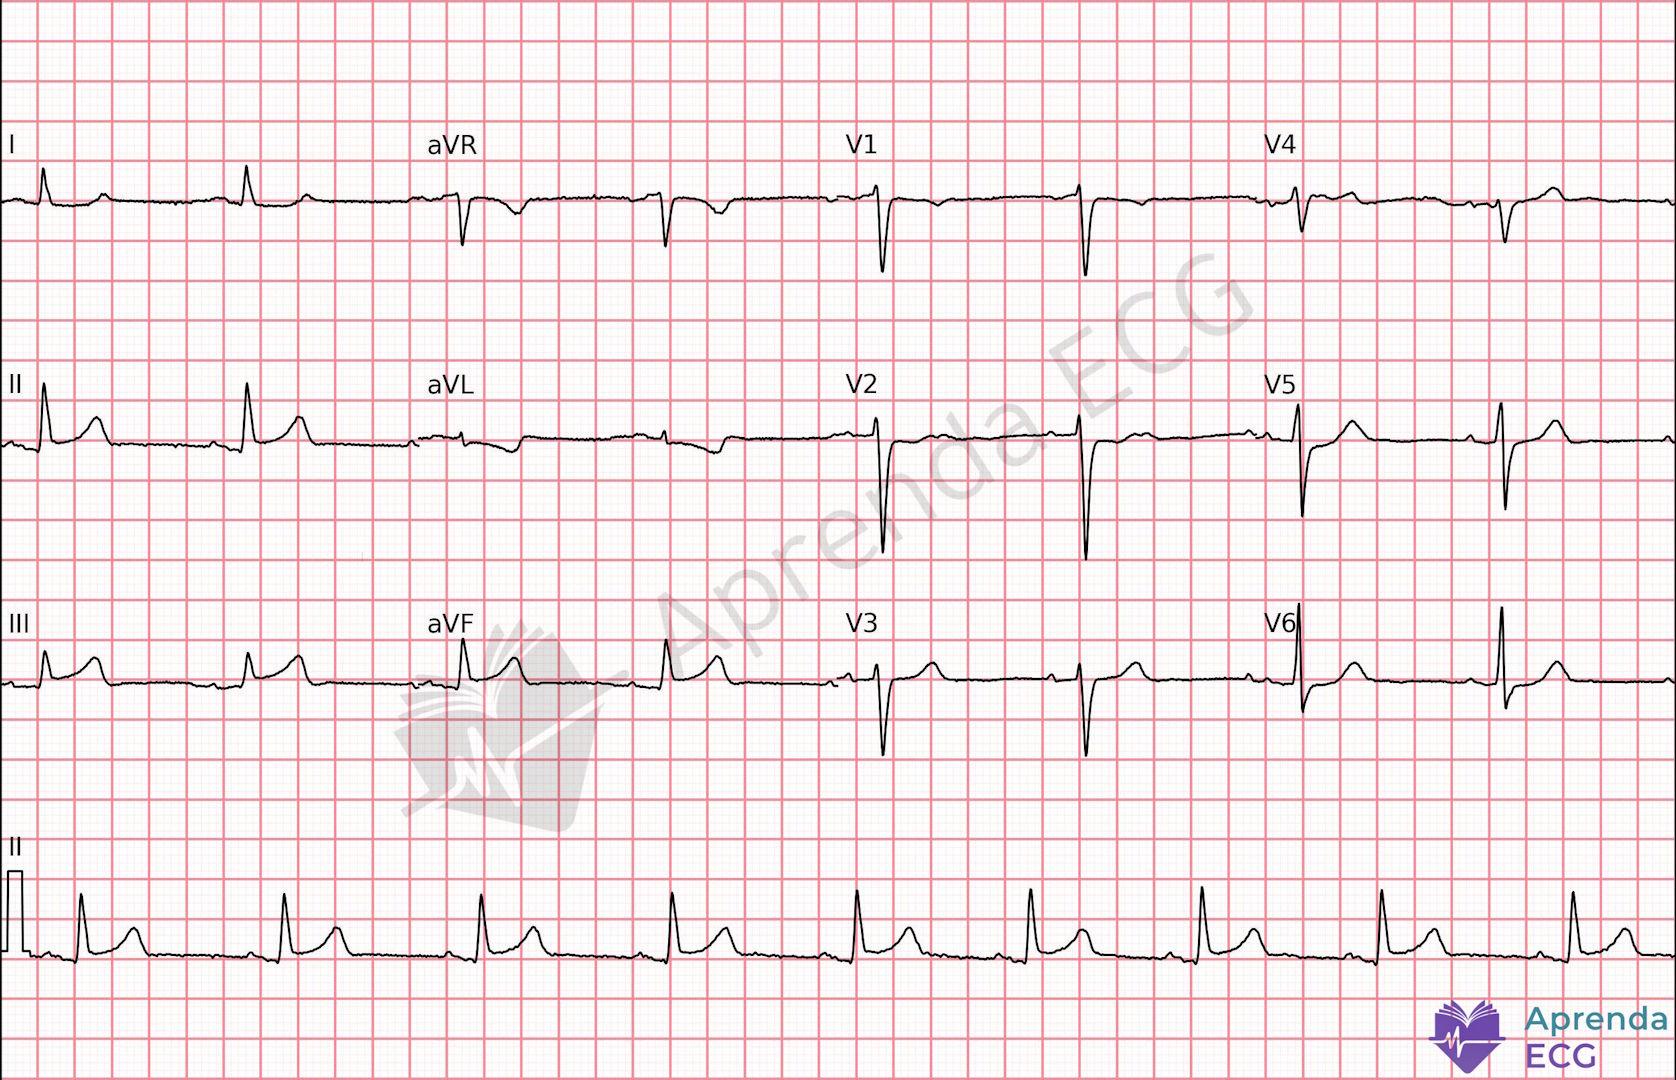
3. Hyperacute T Wave
The hyperacute T wave is often the first specific sign of OMI.
- Broad base
- Symmetry
- Increased area under the curve
- Disproportionate T/QRS ratio
It is not merely increased amplitude, but disproportion relative to the QRS complex. It may precede ST elevation and represents an early phase of occlusion, with potential impact on myocardial salvage when recognized in time 4.
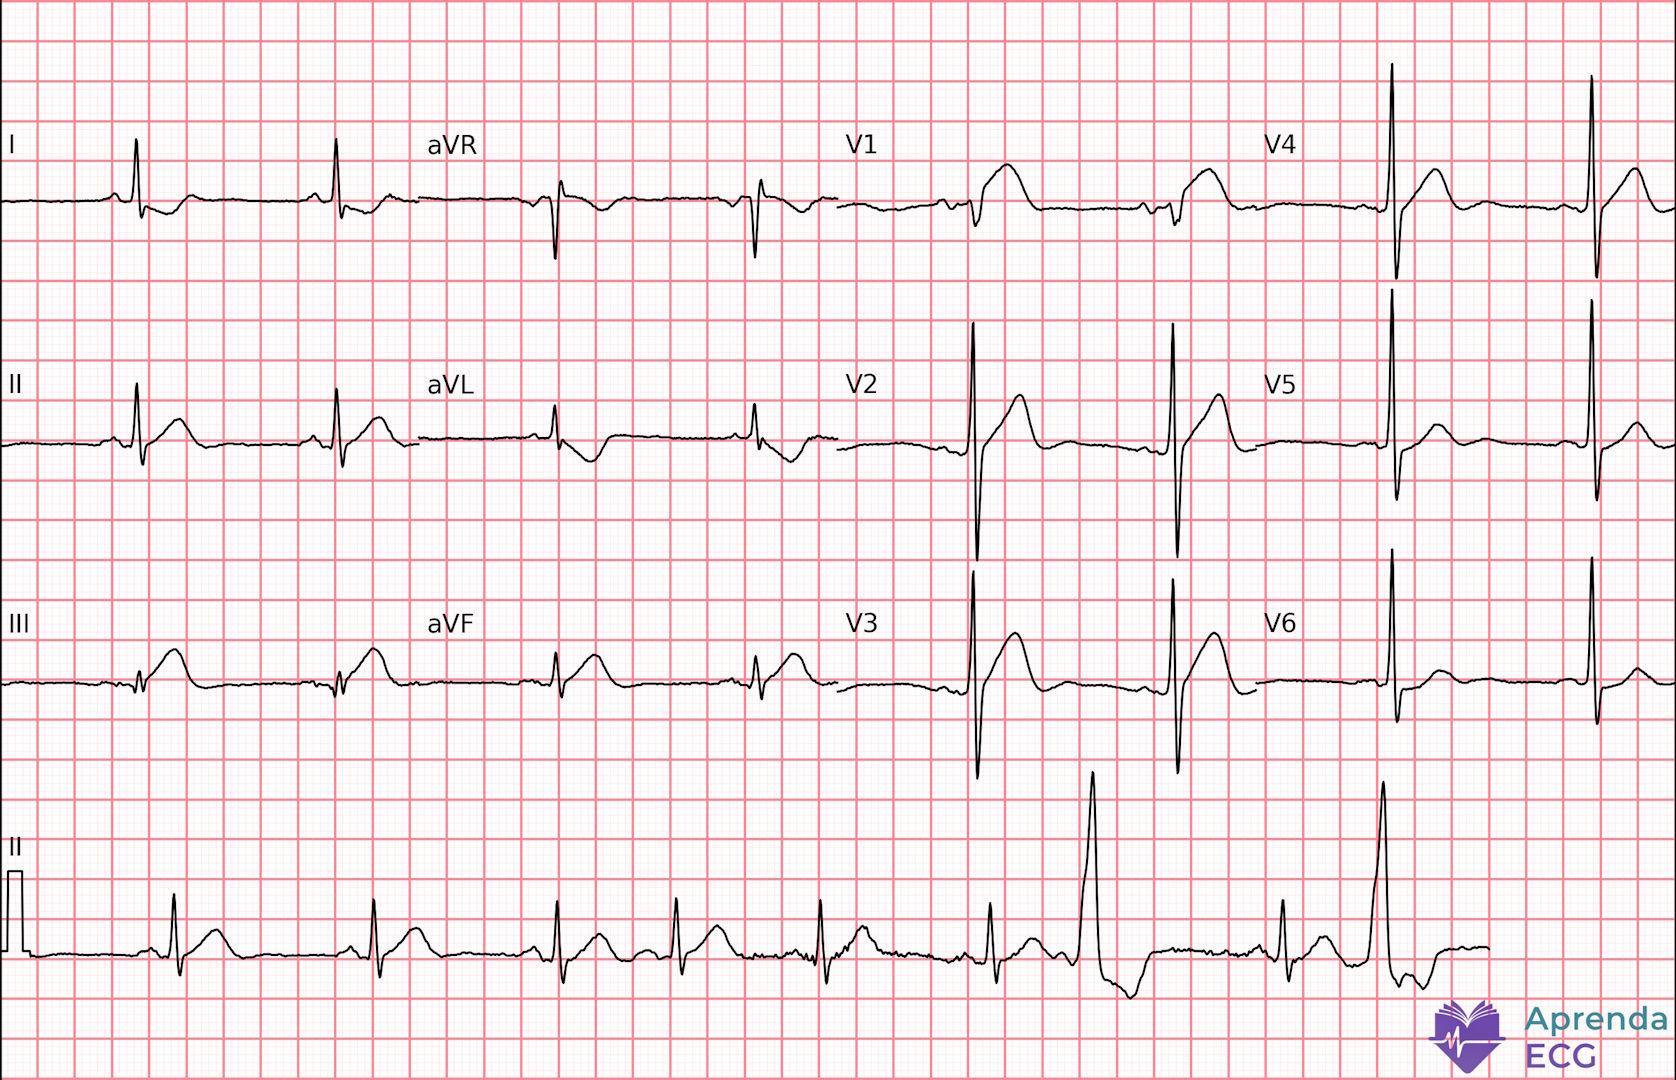
4. de Winter Pattern
Described as an anterior STEMI equivalent, it is characterized by 5:
- Upsloping ST depression of 1–3 mm in V1–V6
- Tall, symmetric T waves
- Slight elevation in aVR
It is typically associated with proximal occlusion of the left anterior descending artery. Despite the absence of classic ST elevation, it requires immediate activation of the cath lab. To review the concept with figures, see the de Winter Pattern.
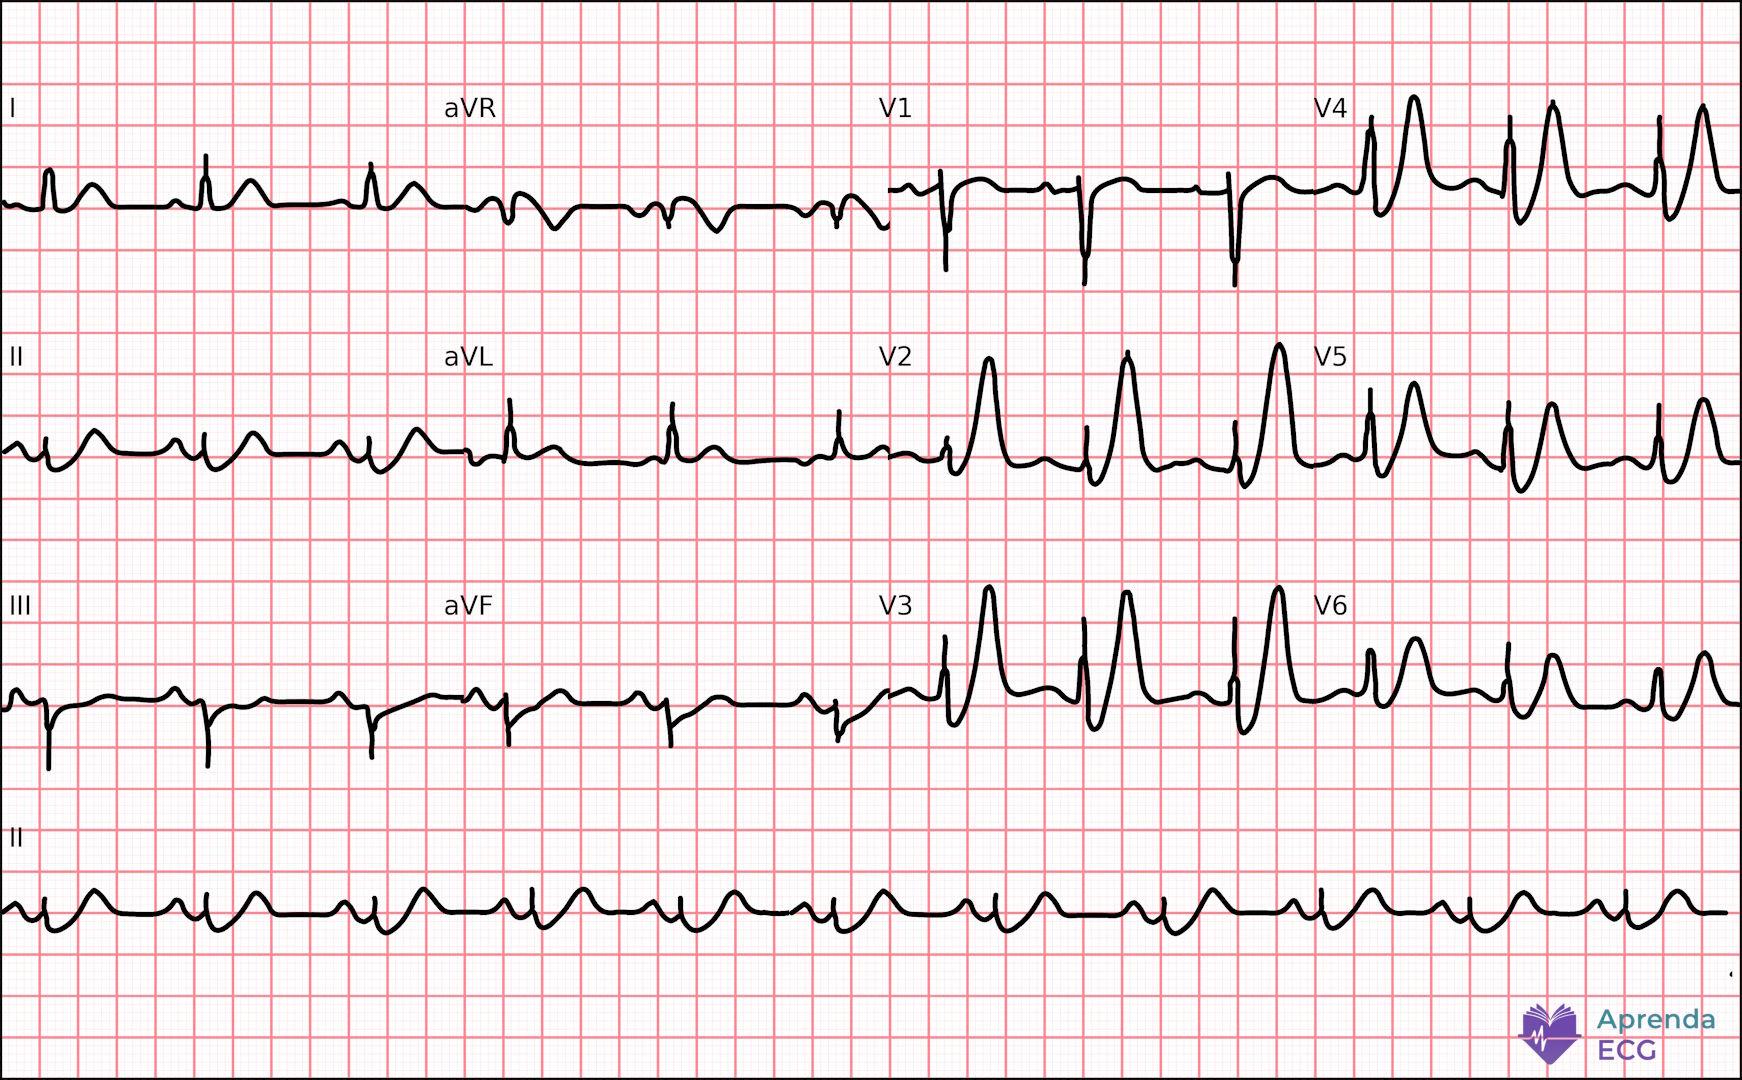
5. Aslanger Pattern
It is characterized by 2,4:
- Isolated elevation in lead III
- ST depression in V4–V6
- No ST elevation in the other inferior leads
It often occurs in patients with multivessel disease and may indicate inferior occlusion in a complex setting. It does not meet traditional criteria for ST elevation in contiguous leads, which favors underdiagnosis. To learn more, see the Aslanger Pattern.
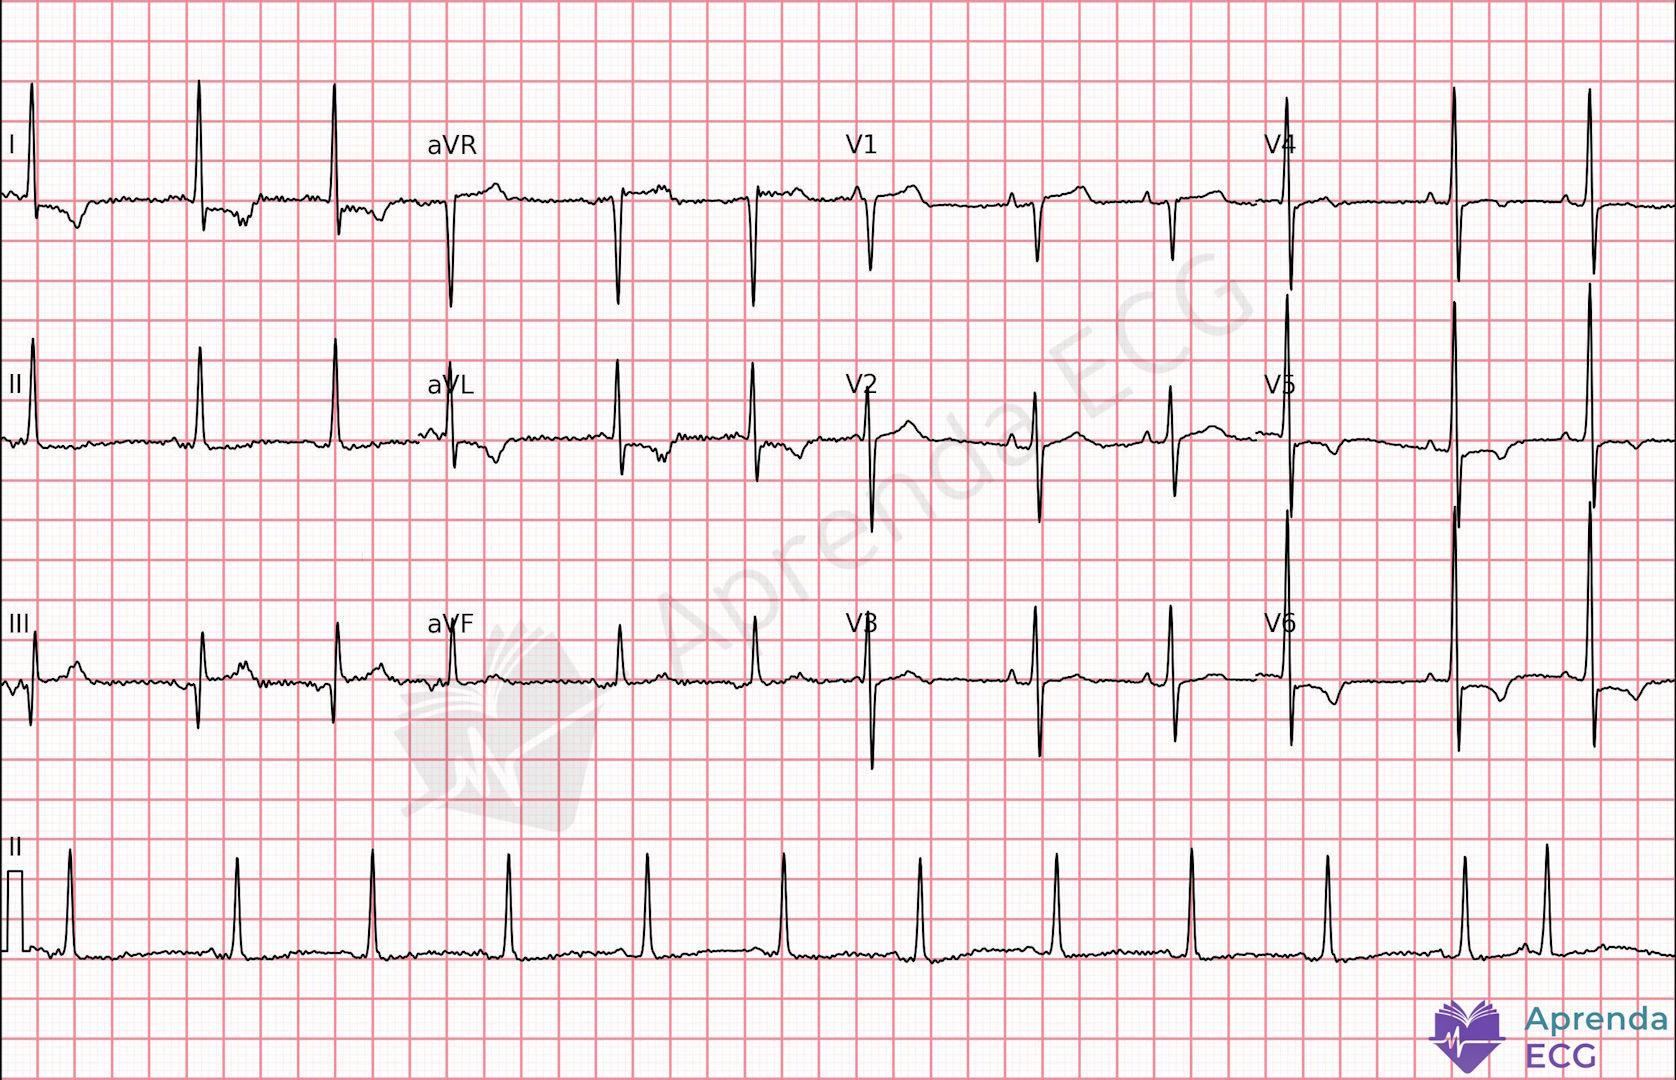
6. ST Depression in V1–V3
Horizontal or downsloping ST depression in V1–V3 may represent the mirror image of lateral ST elevation, frequently associated with occlusion of the circumflex artery 2.
Posterior leads (V7–V9) may confirm the diagnosis, but suspicion should arise from the standard ECG, especially when the clinical context and the evolution of the tracing support acute ischemia.
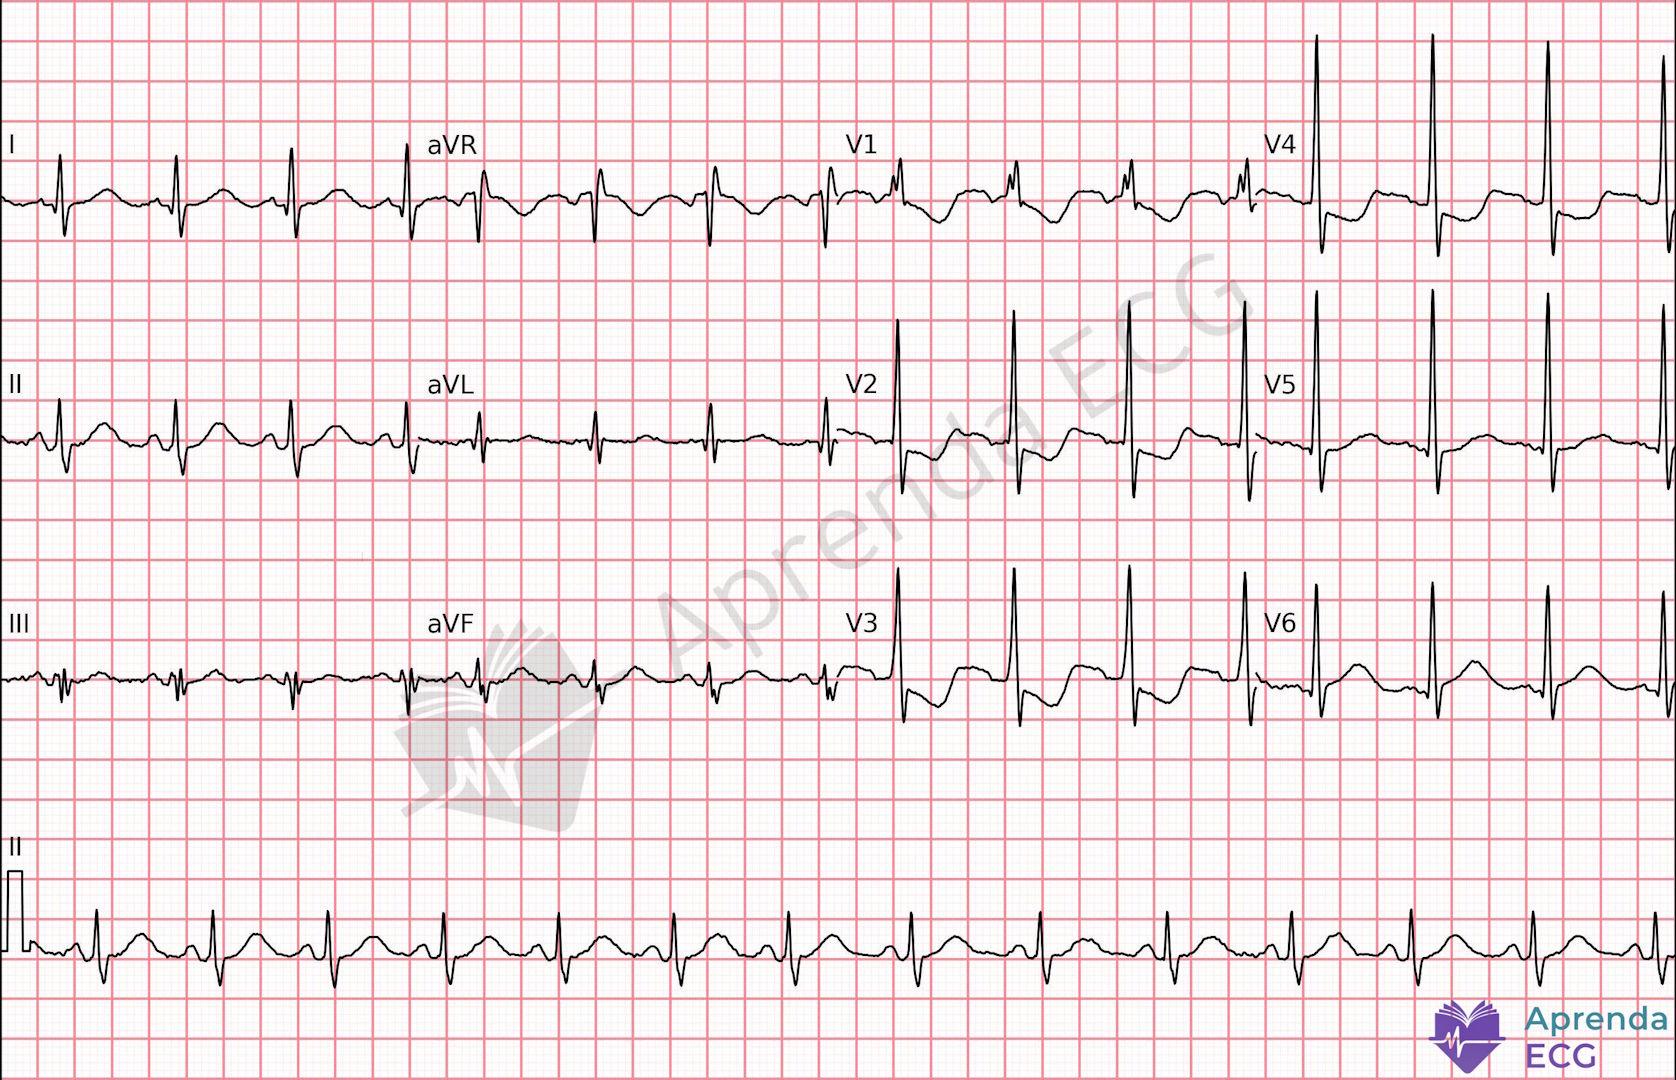
7. South African Flag Sign
It is characterized by 2:
- ST elevation in I and aVL
- Possible extension to V2–V3
- ST depression in the inferior leads
It suggests occlusion of the first diagonal branch of the left anterior descending artery. It is a specific topographic pattern that is often underappreciated during a quick read in the emergency department. See also the South African Flag Sign.
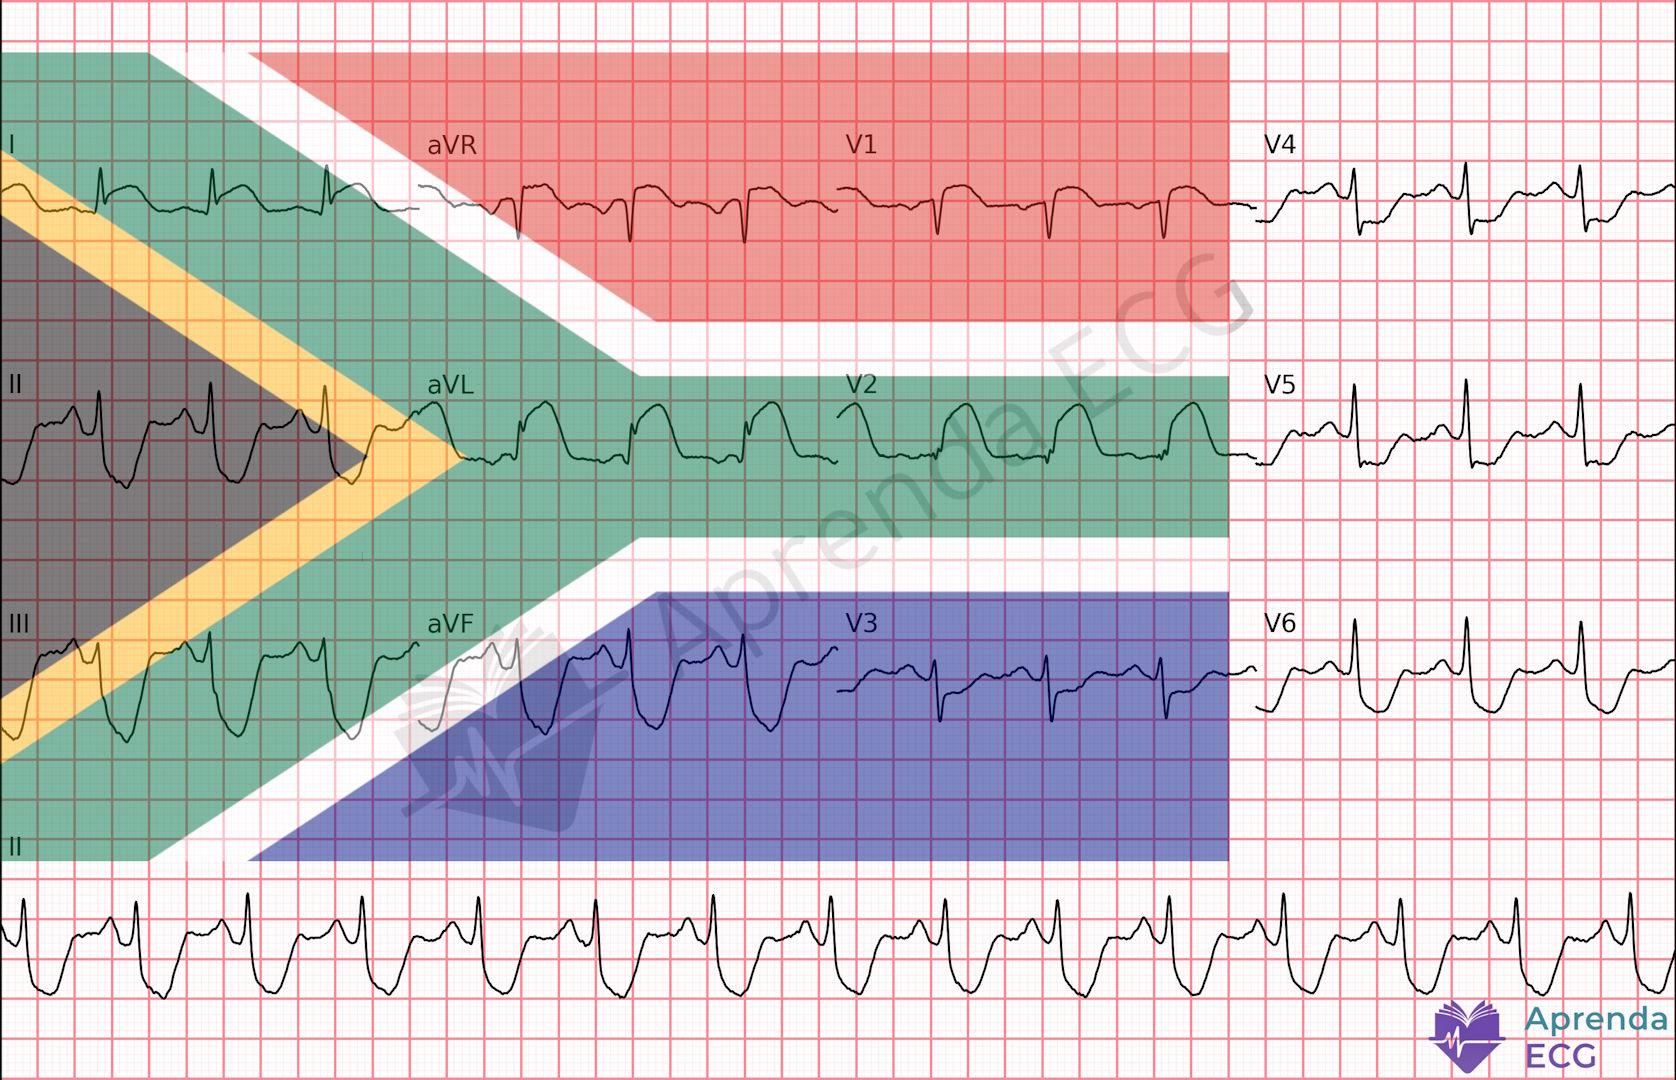
8. Left Bundle Branch Block and the Modified Sgarbossa Criteria
In the presence of LBBB, interpretation of the ST segment becomes complex. The modified criteria include 2,4:
- Concordant ST elevation ≥1 mm
- Concordant ST depression ≥1 mm in V1–V3
- ST/S or ST/R ratio ≥ 0.25
The chronology of the block is irrelevant in the face of a compatible clinical picture. Proper recognition avoids delays in reperfusion.
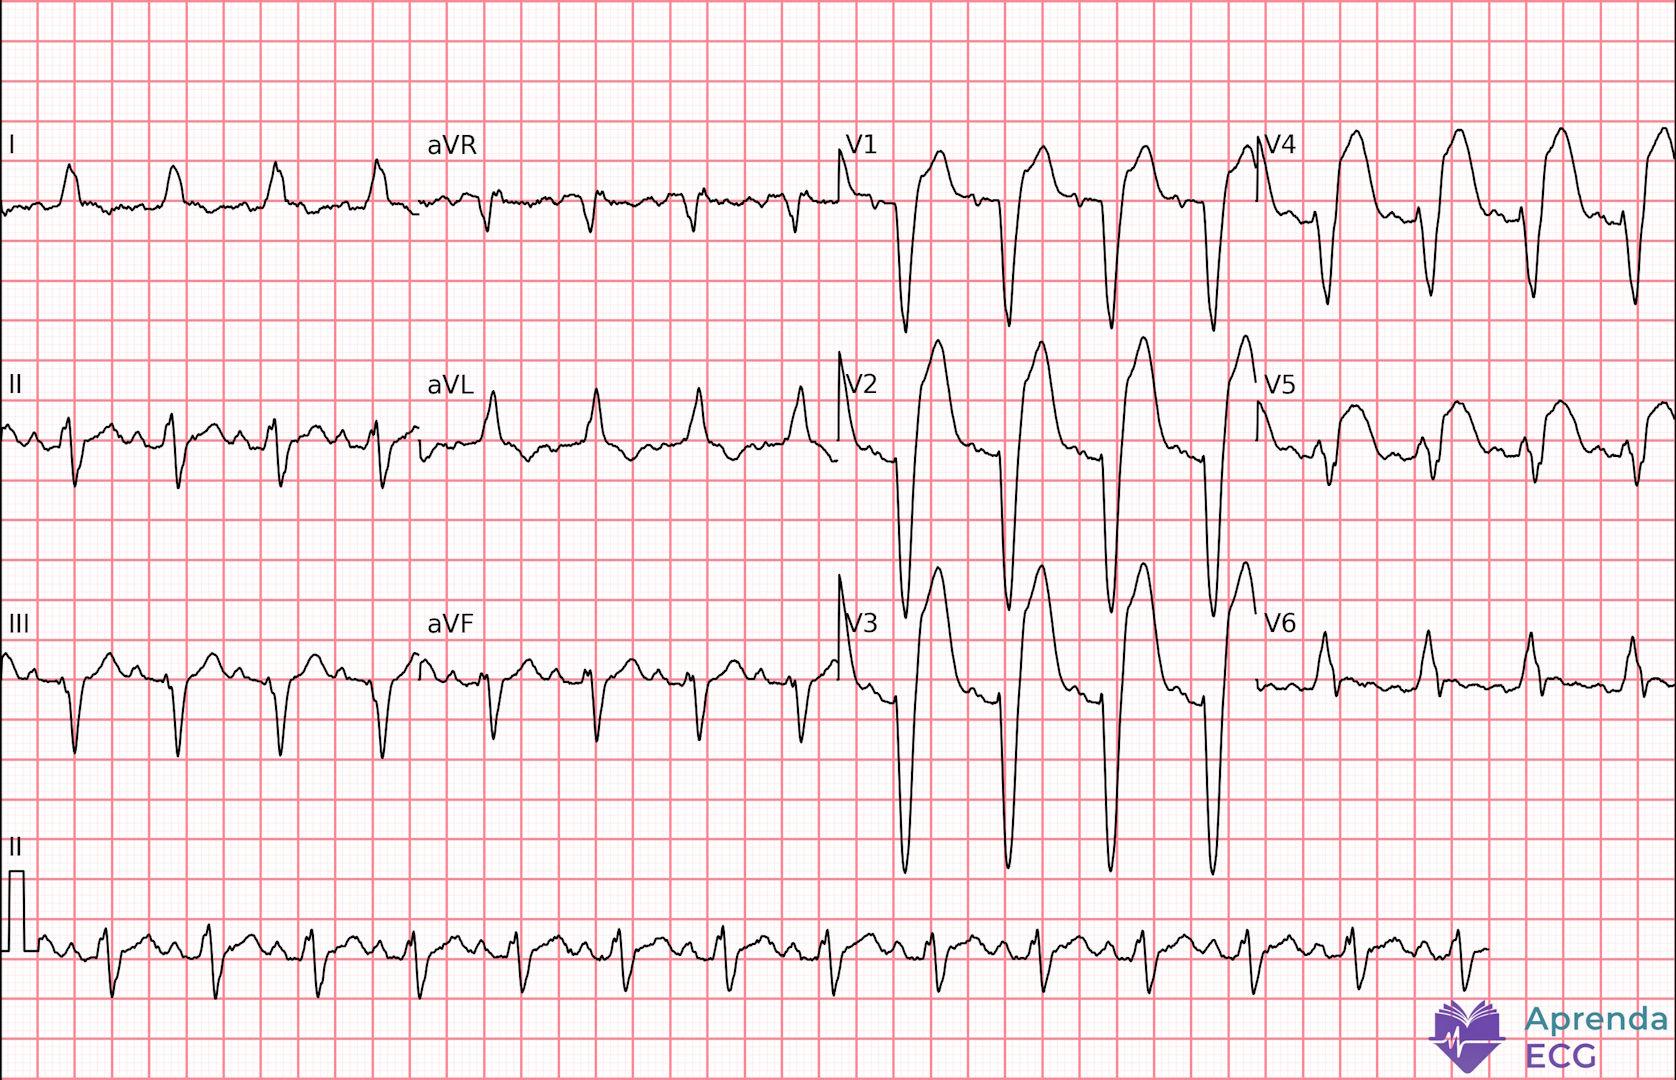
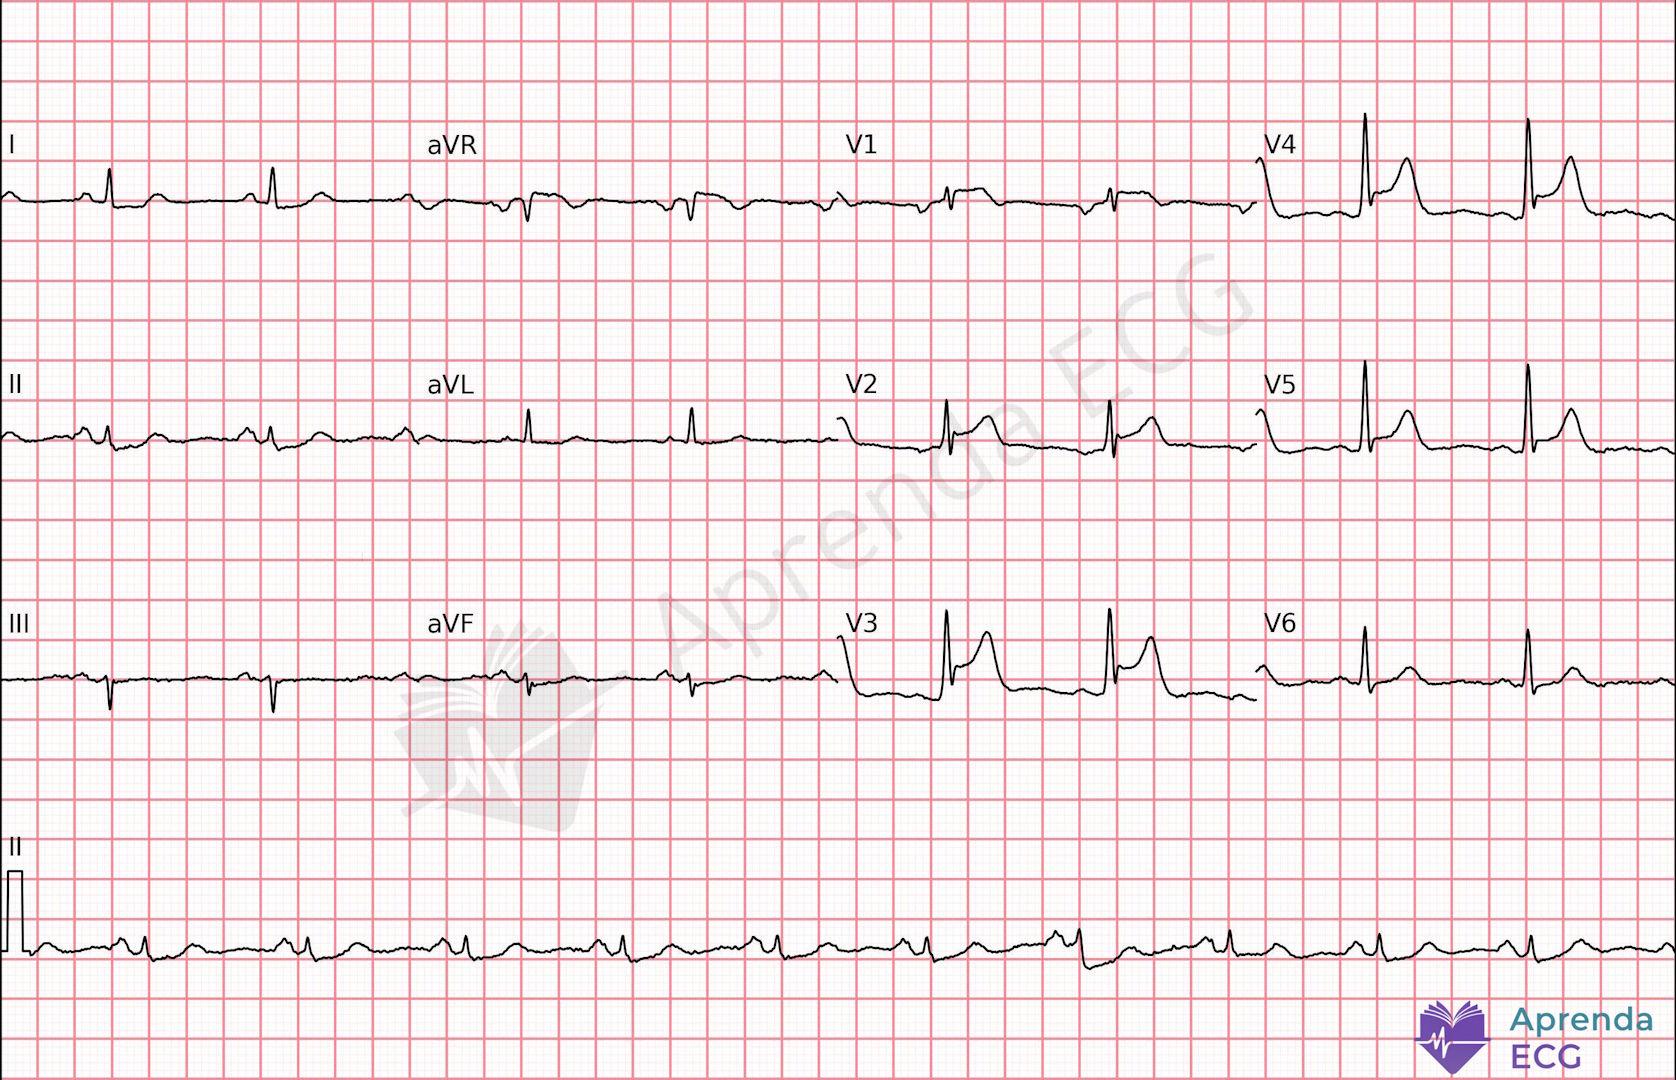
9. Terminal QRS Distortion
The pattern described by Smith refers to terminal QRS distortion in leads V2 and/or V3, characterized by 2:
- Absence of an S wave
- Absence of a notch or J wave
This finding should be interpreted in the context of suspicious anterior ST elevation and indicates that ventricular depolarization is already significantly compromised by ischemia. It is a specific criterion for occlusion of the left anterior descending artery, associated with a higher probability of true occlusion and the need for immediate reperfusion.
10. Smith's 4-Variable Formula
The 4-Variable Formula was developed to differentiate true anterior occlusion from benign early repolarization patterns, especially in cases with subtle ST elevation in V1–V3 4.
Equation:
0.052 × (Bazett QTc, in ms) − 0.151 × (QRS amplitude in V2, mm) − 0.268 × (R-wave amplitude in V4, mm) + 1.062 × (ST elevation measured 60 ms after the J point in V3, mm)
Cutoff: a value ≥ 18.2 strongly suggests anterior coronary occlusion.
The formula should not be used when there are obvious signs of frank anterior infarction, since in these cases the diagnosis is already clear. Its greatest utility lies in scenarios of diagnostic uncertainty between OMI and benign variants.
11. New Signs and Emerging Patterns
Precordial Swirl
A “swirl” vector pattern, characterized by 2:
- ST elevation or hyperacute T wave in V1–V2
- ST depression or T-wave inversion in V5–V6
- Narrow QRS, without criteria for left ventricular hypertrophy or bundle branch block
This pattern suggests an injury vector directed anteriorly and superiorly and is associated with proximal occlusion of the left anterior descending artery. See also: Precordial Swirl.
North OMI
North OMI describes a pattern in which the injury vector is oriented superiorly, producing high lateral ST elevation and ST elevation in aVR 2.
Electrocardiographic criteria:
- Any ST elevation in aVR and aVL, associated with a negative T wave in these leads
- ST depression in the inferior and lateral precordial leads (such as V5–V6), with positive or biphasic T waves
It is an emerging pattern associated with significant coronary occlusion and should be recognized as a possible manifestation of active OMI.
Practical Conclusion: How to Apply It on Shift
Recognizing OMI requires a change of mindset. It is not just a matter of asking “is there ST elevation?”, but rather:
- Is the pattern consistent with active occlusion?
- Are there changes disproportionate to the QRS?
- Are there early signs or equivalents?
- Is the clinical picture compatible?
Interpretation should be dynamic, comparative and integrated with the clinical context. On shift, the practical logic can be summarized in three steps:
- 1. Identify classic ST elevation.
- 2. Look for OMI equivalents in the absence of obvious ST elevation.
- 3. Consider auxiliary tools when in doubt (e.g., the 4-variable formula) and keep a low tolerance for ECG “false negatives” in a compatible patient.
If you want to standardize your reading (and reduce “quick glance” errors), it is worth reviewing the systematic approach to ECG interpretation.
For further study and standardized interpretation, it is recommended to integrate content from textbooks and recent reviews on the OMI/NOMI paradigm and the electrocardiographic patterns of OMI 1-6.
Time is muscle, but only for those who recognize the occlusion.
References
- De Alencar JN, Feres F, De Marchi MFN, Franchini KG, Scheffer MK, Felicioni SP, et al. Além do Paradigma IAMCSST-IAMSSST: Proposta do Instituto Dante Pazzanese para o Diagnóstico de Oclusão Coronariana Aguda. Arq Bras Cardiol. 2024;121(5):e20230733.
- Alencar JN, Silva GPSA, Pinto LO, De Marchi MFN, Felicioni SP, Scheffer MK. Sinais Eletrocardiográficos de Oclusão Coronária Aguda. Rev Soc Cardiol Estado de São Paulo. 2025;35(3):317-26.
- Alencar Neto JN, Scheffer MK, Correia BP, Franchini KG, Felicioni SP, De Marchi MFN. Systematic review and meta-analysis of diagnostic test accuracy of ST-segment elevation for acute coronary occlusion. Int J Cardiol. 2024.
- Ricci F, Martini C, Scordo DM, Rossi D, Gallina S, Fedorowski A, et al. ECG Patterns of Occlusion Myocardial Infarction: A Narrative Review. Ann Emerg Med. 2024.
- Felicioni SP, De Alencar JN, Centemero MP, Lourenço UR, De Marchi MFN, Scheffer MK, et al. The de Winter electrocardiographic pattern: A systematic review of case reports. J Electrocardiol. 2024;87:153821.
- Scheffer MK, de Alencar Neto JN, De Marchi MFN, Felicioni SP. Eletrocardiograma na síndrome coronária aguda. São Paulo: Manole; 2025.