

The electrocardiogram (ECG) is one of the most widely used tests in clinical practice and, paradoxically, one of the most misinterpreted. Part of the problem lies not in the method but in the number of ECG myths that have been repeated over time until they acquired the status of truth.
“Smiley” ST elevation, T waves equated with “subepicardial ischemia”, poor R-wave progression as an anterior scar, S1Q3T3 as pathognomonic of pulmonary embolism (PE), the dorsal wall, infallible algorithms, voltage equals hypertrophy. These concepts seem to make reading the tracing easier, but in practice they oversimplify complex electrical phenomena, and that comes at a clinical cost.
In this article, we review some of the main ECG myths, explaining why they arose, why they do not hold up in light of pathophysiology and current scientific evidence, and how to interpret these findings in a more mature and safer way. The goal is not to memorize new criteria but to change the way we think about the ECG.
Because, in the end, the tracing rarely lies. What usually fails is the automatic, decontextualized reading, full of myths.
The Smiley ST Elevation
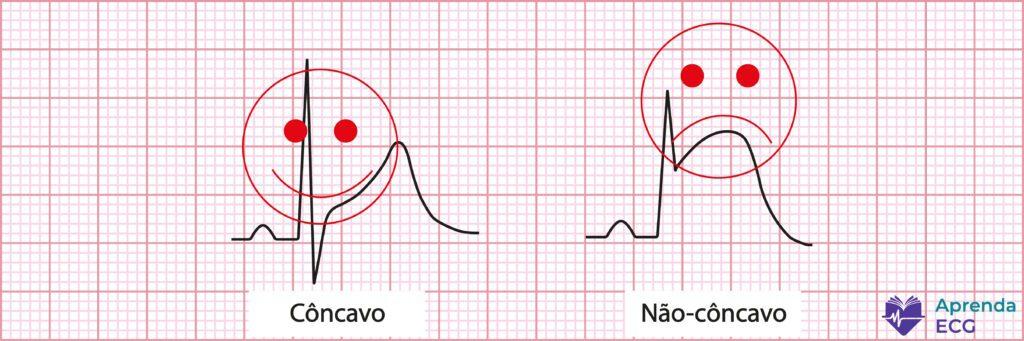
There is a classic ECG myth that spans generations: concave ST elevation is benign, convex ST elevation is ischemic. This gave rise to the informal (and dangerously reassuring) term “smiley ST elevation”.
The idea seems simple, almost comforting: if the ST segment is smiling, the heart is fine. If it is frowning, you'd better hurry. The problem is that the myocardium never read that manual.
Several studies have shown that ST morphology alone cannot reliably distinguish ischemia from non-ischemic causes. A classic study by Smith et al. showed that concave ST elevation was present in up to 43% of patients with acute occlusion of the left anterior descending artery, dismantling the idea that the “smiling” shape is protective.
In clinical practice, this means something simple and uncomfortable: a concave ST segment does not rule out infarction. Moreover, in some settings it may even be associated with earlier phases of coronary occlusion, before the injury has evolved into more florid patterns.
Another often-forgotten point is that ST shape is dynamic. The same patient may start with concave ST elevation, progress to a straightened ST segment and, hours later, show a convex pattern. Taking a snapshot of a single moment of the tracing and drawing definitive conclusions is a classic mistake.
It is worth remembering that this myth has already been discussed in detail here on the blog, including real ECG examples and a literature review. For those who want to dig deeper, it is worth reading: The Myth of the Smiley ST Elevation.
So, if the smiley ST elevation does not exist, what does matter?
The clinical context matters. Reciprocal changes matter. Comparison with prior ECGs matters. Serial evolution of the tracing matters. The ST segment should not be judged by its smile, but by the story it tells together with the patient.
Poor R-Wave Progression
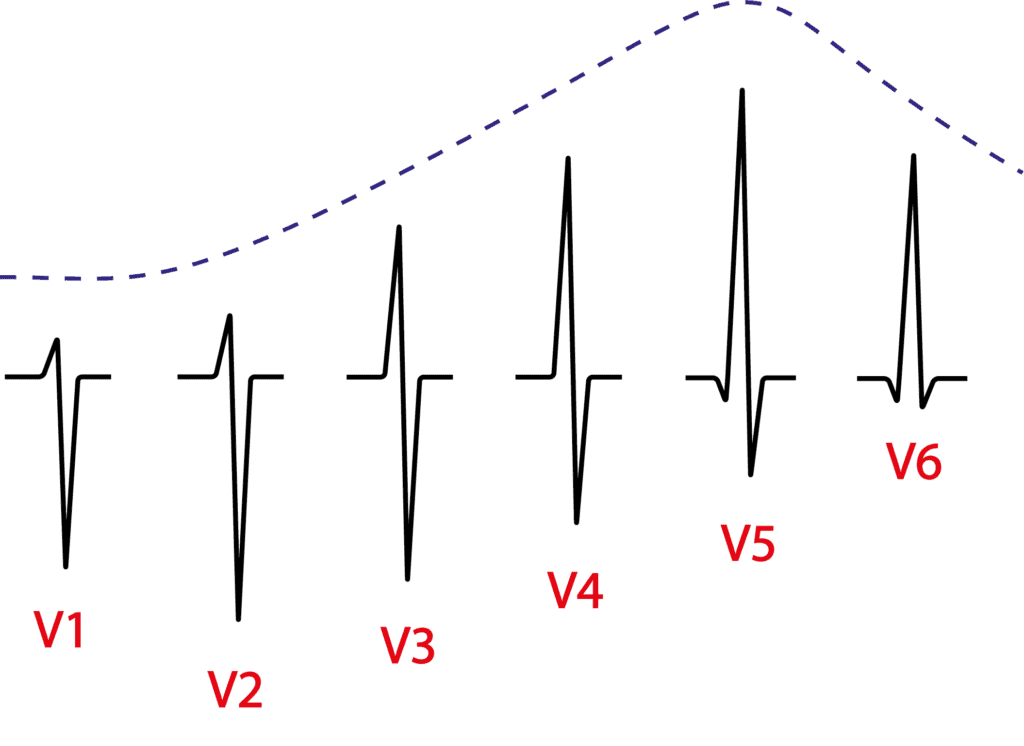
Another classic ECG myth is the idea that poor R-wave progression in the precordial leads is, by definition, a reliable marker of old anterior wall infarction. This concept has been repeated for decades in textbooks, automated reports and bedside discussions, often without question.
Traditionally, we are taught that the R wave should grow progressively from V1 to V4–V5. When this does not happen and the R wave remains small or “delayed” in the anterior leads, the label poor R-wave progression appears. The problem begins when this isolated finding is automatically interpreted as myocardial scar.
Reality is far less elegant.
Poor R-wave progression has no single definition in the literature. There are multiple diagnostic criteria, some extremely simple (such as R ≤ 3 mm in V3), others so complex that they look like applied physics formulas. This lack of standardization alone should be enough to warrant caution.
Even more important: the scientific evidence supporting the association between poor R-wave progression and old infarction is weak. The classic studies are old, methodologically limited and frequently biased. When the literature is critically appraised, there are no robust data validating this finding as a reliable marker of anterior necrosis.
In practice, poor R-wave progression is a nonspecific and relatively common finding, which may be present in people without any coronary disease. Conduction disturbances, ventricular hypertrophy, preexcitation, electrode placement and even anatomical variants, such as clockwise rotation of the heart, explain many of these tracings.
In other words: poor R-wave progression is not synonymous with old infarction. Using it alone to make a retrospective diagnosis is a conceptual error that can lead to unnecessary testing, wrong labels and avoidable anxiety.
As with the smiley ST elevation myth, the golden rule of the ECG applies here too: no finding should be interpreted out of context.
Before calling it an old infarction, ask yourself: is the tracing telling a complete story, or just a sentence out of context?
Negative T Waves and Subepicardial Ischemia
Few ECG terms are repeated as often (and understood as poorly) as the idea that a negative T wave corresponds to subepicardial ischemia. This label still appears in lectures, old textbooks and, unfortunately, routine reports. The problem is that it is conceptually wrong.
Let's get to the central point: a negative T wave does not indicate acute ischemia.
In ischemic heart disease, T-wave inversion is, in most cases, a post-ischemic phenomenon, related to reperfusion (spontaneous or induced) and myocardial edema. This is what we see after an artery opens, after thrombolysis or even after transient episodes of occlusion. The classic Wellens pattern is the best example: deeply negative T waves in a patient who is no longer ischemic at that moment, but who is at high risk of reocclusion if nothing is done.
In other words: the negative T wave looks at the past, not the present.
But the error doesn't stop there.
From a pathophysiological standpoint, there is no ischemia confined to the epicardium. When an epicardial coronary artery occludes, ischemia inevitably begins in the subendocardium, the most vulnerable region, and rapidly progresses toward the epicardium, becoming transmural. There is no realistic scenario in which the epicardial myocardium is ischemic while the subendocardium is spared.
Therefore, the term “subepicardial ischemia” is not just imprecise: it describes something that does not happen physiologically.
Moreover, the negative T wave is an extremely nonspecific finding. It can be seen in ventricular hypertrophy, bundle branch block, cardiomyopathies, myocarditis, pericarditis, electrolyte disturbances, acute neurological events, post-tachycardia electrical memory and even as a normal variant. Interpreting it in isolation as active ischemia is a recipe for diagnostic error.
In practice, this leads to two important messages:
- A negative T wave should not be reported as acute ischemia.
- The term subepicardial ischemia should not be used in ECG reports.
Like other ECG myths, this one persists more out of tradition than science. Interpreting the T wave correctly requires clinical context, analysis of depolarization, comparison with prior tracings and, above all, an understanding of the real pathophysiology of myocardial ischemia.
On the ECG, a negative T wave does not shout “infarction now”. Most of the time it merely whispers: something already happened here.

Increased P-Wave Duration
Another myth deeply rooted in ECG teaching is the idea that a wide P wave (≥ 120 ms) is synonymous with left atrial enlargement (LAE). This concept is repeated almost automatically, but it does not withstand closer electrophysiological analysis.
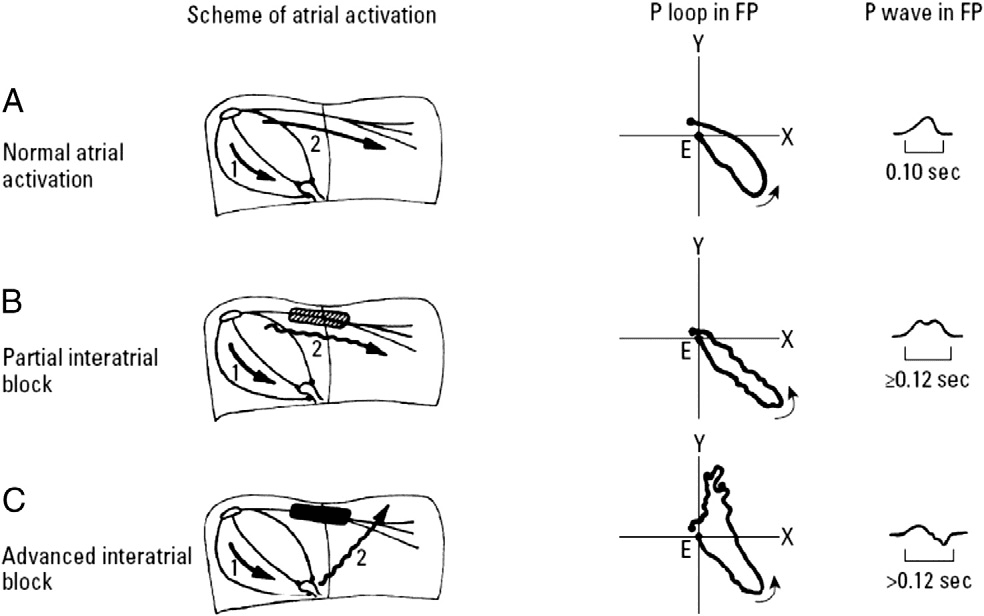
In reality, increased P-wave duration is primarily a marker of delayed interatrial conduction, that is, interatrial block (IAB), and not of increased left atrial mass or volume.
The logic is simple: when something becomes wider on the ECG, we are almost always talking about conduction delay, not hypertrophy. Just as a wide QRS suggests bundle branch block rather than a “big ventricle”, a prolonged P wave reflects delayed propagation of the electrical impulse from the right atrium to the left atrium.
This concept was elegantly systematized by Bayés de Luna, who showed that the classic patterns of a long P wave, isolated or with a plus-minus morphology in the inferior leads, correspond to different degrees of interatrial block, an entity distinct from left atrial enlargement.
The key point, often overlooked, is that interatrial block can exist without left atrial dilation, and the reverse is also true. Echocardiography and cardiac magnetic resonance studies have shown that a P wave ≥ 120 ms has low diagnostic value for LAE on its own, but an excellent correlation with atrial conduction disturbances.
When the delay is more advanced, with functional block in Bachmann's region, the impulse activates the left atrium retrogradely, producing the classic P wave with a ± morphology in II, III and aVF: so-called advanced interatrial block, the electrocardiographic basis of Bayés syndrome, which is associated with a higher risk of atrial fibrillation, atrial flutter and thromboembolic events.
In practice, this changes everything.
Reporting a long P wave as “left atrial enlargement” is not only imprecise but also misses the opportunity to recognize a relevant arrhythmic marker. The correct term describes the real mechanism: delayed interatrial conduction.
It is worth noting that this topic has already been discussed at length here on the blog, from both a conceptual and a clinical standpoint:
In short: a wide P wave speaks not of size but of time. And on the ECG, time almost always means conduction.
The S1Q3T3 Pattern
Few ECG patterns carry such great (and disproportionate) symbolic weight as S1Q3T3. Many still see it as an almost pathognomonic sign of PE. Reality, however, is very different.
The S1Q3T3 pattern simply describes three findings: a deep S wave in I, a Q wave in III and a negative T wave in III. It reflects an acute rightward shift of the electrical axis, usually associated with sudden right ventricular overload. And here is the first important point: it speaks of physiology, not cause.
Historically, S1Q3T3 was described in 1935 by McGinn and White in patients with acute cor pulmonale. Since then, the pattern has become embedded in the medical imagination as “the PE ECG”. The problem is that, when studied systematically, this link proves weak.
In practice, S1Q3T3 is neither sensitive nor specific for PE. It appears in a minority of patients with pulmonary embolism and may be present in many other conditions involving acute or chronic right ventricular overload, such as COPD exacerbation, pulmonary hypertension, pneumothorax, severe asthma attacks and even non-cardiopulmonary situations.
Even when present in the setting of PE, its diagnostic value is limited. Modern diagnostic accuracy studies show that S1Q3T3 produces only a small increase in post-test probability, insufficient to reliably confirm or rule out the diagnosis. In other words: it impresses more than it helps.
The most common conceptual error is to reverse the reasoning: seeing an S1Q3T3 and concluding “this is PE”. The correct approach is exactly the opposite. The ECG never establishes the diagnosis of PE. At most, it can suggest right ventricular overload in a patient whose clinical history already raises that hypothesis.
That is why S1Q3T3 should be understood for what it really is: a nonspecific marker of right ventricular strain, not a diagnostic stamp of pulmonary embolism.
This topic has already been discussed in depth here on the blog, in one of the most-read articles on Aprenda ECG: The S1Q3T3 Pattern.
If there is one myth to abandon, it is this one: S1Q3T3 does not diagnose PE. It merely reminds us that the right ventricle is suffering, and that the next step depends on the clinical context, not on the tracing alone.
The Dorsal Wall
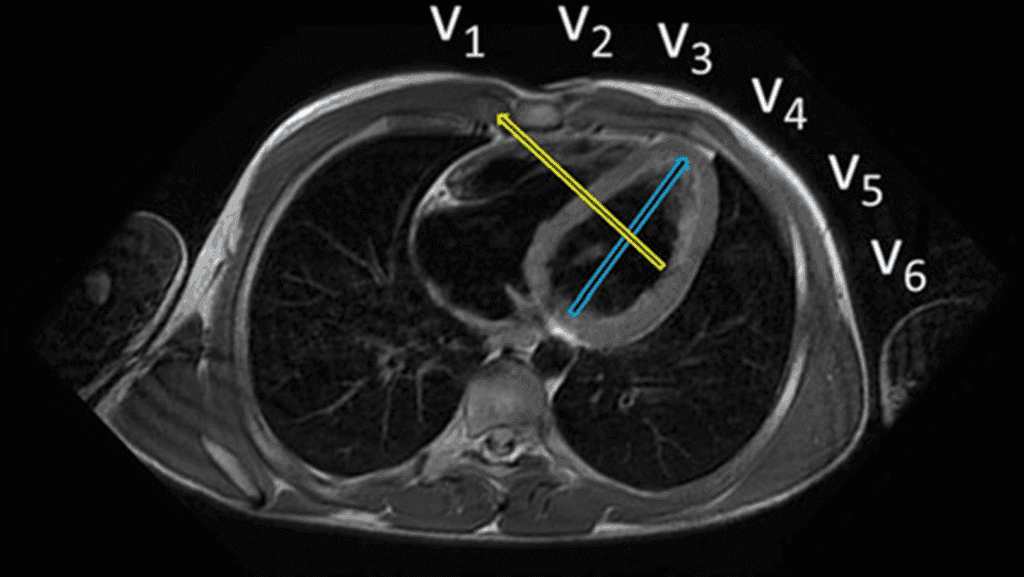
The so-called “dorsal wall” is one of the most enduring ECG myths. For decades, we were taught that certain changes, especially a tall R wave in V1–V2, represented a posterior (or dorsal) wall infarction. The problem is that this wall, as it was imagined, practically does not exist.
The error stems from a mistaken anatomical premise. The heart does not sit in the chest as an anterior–posterior block. It lies obliquely, and the region formerly called “posterior” actually corresponds to the inferobasal segment, which is part of the inferior wall rather than an independent wall.
With advances in cardiac magnetic resonance imaging, this dogma fell. ECG–CMR correlation studies showed that:
- An increased R wave in V1–V2 does not indicate posterior infarction.
- When related to infarction, this pattern most often corresponds to lateral wall infarction, whose necrosis vector projects toward the right-sided leads.
- An isolated infarction of the supposed “posterior wall” is exceptionally rare.
That is why modern terminology has abandoned the term “posterior/dorsal wall”. The current classification describes the walls more precisely: anterior, septal, lateral and inferior, with their basal, mid and apical segments. What used to be called “posterior” is now correctly recognized as inferior (inferobasal).
In clinical practice, insisting on the dorsal wall label creates diagnostic confusion, misinterpretation of the ECG and imprecise communication among clinicians, interventional cardiologists and imaging specialists. Naming things wrong means thinking wrong.
If the goal is to localize the infarction more precisely, the way forward is not to revive old concepts but to understand the real anatomy and the electrical vectors involved.
For those who want to go deeper (and truly organize this topic), I strongly recommend the blog article on the walls of the infarction, which brings together anatomy, ECG and imaging evidence:
Myth summary: the dorsal wall is not a valid anatomical entity in modern ECG interpretation. The tracing gets better when the nomenclature gets better too.
The Accuracy of Wide QRS Tachycardia Algorithms
Perhaps no ECG topic generates as much overconfidence as the algorithms for the differential diagnosis of wide QRS tachycardias. Well-designed flowcharts, numbered steps and impressive sensitivity and specificity figures create the feeling that the problem is solved. It is not.
The classic example is the Brugada algorithm. In the original study, published in 1991, performance was nearly perfect: sensitivity and specificity above 95%, something extremely rare in diagnostic medicine. The problem is that this performance has never been consistently reproduced in external cohorts.
When other groups began testing the Brugada algorithm in different populations and with less specialized observers, the picture changed. Sensitivity for ventricular tachycardia (VT) remained relatively high, but specificity dropped substantially, often to values between 40% and 60%. In practical terms, this means a high number of false positives for VT.
This phenomenon is not unique to Brugada. Comparative studies show that no single algorithm is accurate enough to resolve the differential diagnosis of wide QRS tachycardias in every setting. In external validations, the overall accuracy of most methods (Brugada, Vereckei, Bayesian, Griffith, R-wave peak time in II) usually falls in the 70% to 77% range.
There are clear reasons for this.
First, many criteria depend on subjective interpretation, especially the morphological criteria. What exactly is an RS complex? Where does the R wave end and the S wave begin? Is the notch real or an artifact? Small differences in interpretation completely change the algorithm's result.
Second, the algorithms were developed mainly to distinguish VT from SVT with aberrancy, but they frequently fail in preexcited supraventricular tachycardias, which activate the ventricle through myocardial conduction and perfectly mimic VT on the ECG.
Third, the performance of the algorithms depends heavily on the observer's experience and the clinical context. Idiopathic VTs, fascicular VTs, and patients with preexisting blocks or myocardial scars further reduce the reliability of the classic criteria.
The conceptual error arises when the algorithm stops being an auxiliary tool and is treated as the final arbiter of the diagnosis. No algorithm changes the most important epidemiological fact on this topic: most wide QRS tachycardias are ventricular tachycardia, especially in the presence of structural heart disease.
That is why guidelines are clear and pragmatic: every wide QRS tachycardia should be treated as VT until proven otherwise, especially in the acute setting. Interestingly, the algorithms themselves barely appear in the guidelines' immediate management pathways, a clear sign of their clinical limitations.
In short, algorithms organize reasoning, help with teaching and are useful in post-acute analysis. But blindly trusting their accuracy is yet another ECG myth.
In the real world, the diagnosis of wide QRS tachycardias remains probabilistic, contextual and clinical. The ECG helps, but it does not decide alone.
Increased QRS Amplitude
Perhaps no ECG criterion is as deeply associated with the idea of ventricular hypertrophy as increased QRS voltage. From the early Sokolow‑Lyon criteria to Cornell, the logic taught is simple: a bigger ventricle produces a bigger QRS. The problem is that this relationship, although intuitive, is incomplete and often misleading.
The classic paradigm assumes that increased left ventricular mass generates a larger electrical field, which necessarily translates into larger QRS amplitudes. However, as Bacharova and colleagues have argued, the ECG does not record mass, but rather electrical phenomena. And these phenomena depend much more on the electrophysiological properties of the myocardium than on its size alone.
From a biophysical standpoint, the voltage recorded on the ECG is explained by the solid angle theorem, which shows that the signal depends not only on the extent of the activation front (related to mass) but also on conduction velocity, intracellular and extracellular conductivity and the proportion of electrically active to inactive tissue. In other words: mass is only part of the story.
In true left ventricular hypertrophy, the myocardium undergoes profound structural changes: cardiomyocyte hypertrophy and branching, gap junction remodeling (especially of connexin‑43), interstitial fibrosis, inflammation and, frequently, associated ischemia. These changes alter both electrical activation and impulse propagation and can increase, maintain or even reduce QRS voltage, regardless of ventricular mass.
This helps explain a classic and undervalued finding: the low sensitivity of voltage criteria. Even in the original Sokolow‑Lyon study, only about 30% of patients with anatomical hypertrophy showed a significant increase in voltage. The so-called “false negatives” are not an ECG error; they actually reflect an electrically diseased myocardium, often with diffuse fibrosis.
Interestingly, magnetic resonance studies show that the greater the myocardial fibrosis, the lower the QRS voltage tends to be, even in frankly hypertrophied ventricles. In some settings, the absence of electrocardiographic hypertrophy criteria is associated with a worse prognosis, as observed in patients with aortic stenosis undergoing TAVI.
The reverse is also true: high QRS voltage does not guarantee true hypertrophy. Regional conduction abnormalities, localized fibrosis, transient ischemia and even acute conditions can increase voltage and mimic classic hypertrophy criteria, even without a real increase in ventricular mass.
That is why the concept is gaining ground that the ECG should not be used to “measure hypertrophy” but to assess electrophysiological remodeling. More modern proposals suggest analyzing the relationship between QRS voltage and ventricular mass (or ventricular area), to understand how much myocardium is needed to generate a given voltage: a far more pathophysiological approach than simply counting millimeters.
Myth summary: a tall QRS is not synonymous with a large ventricle, and a normal QRS does not rule out significant hypertrophy. QRS voltage speaks less of size and much more of the electrical quality of the myocardium. On the ECG, as almost always, the problem is not the tracing but its simplistic interpretation.
Conclusion
ECG myths do not persist by chance. They survive because they offer quick, simple and comfortable answers for a test that is actually complex, contextual and probabilistic. The problem is that, on the ECG, cognitive shortcuts almost always come at a clinical cost.
Throughout this article, we have seen classic examples of this error: the smiley ST elevation that does not rule out infarction, poor R-wave progression that does not define an anterior scar, the negative T wave that does not indicate acute ischemia, the long P wave that speaks of conduction rather than size, the S1Q3T3 that does not diagnose PE, the nonexistent dorsal wall, the false precision of wide QRS algorithms and the trap of interpreting voltage as mass.
The common thread is always the same: interpreting isolated findings outside the clinical and pathophysiological context. The ECG was not designed to provide automatic labels but to integrate electrical, anatomical and clinical information into coherent reasoning.
Perhaps the main message is this: the ECG is wrong less often than we think. We are the ones who get it wrong more often, when we try to oversimplify it. Reading an electrocardiogram well requires abandoning myths, accepting uncertainty and, above all, understanding the why behind the tracings, not just memorizing them.
References
- Scheffer MK, de Alencar Neto JN, De Marchi MFN, Felicioni SP. Eletrocardiograma na síndrome coronária aguda. São Paulo: Manole, 2025.
- Smith SW. Upwardly concave ST segment morphology is common in acute left anterior descending coronary occlusion. J Emerg Med. 2006;31(1):69–77.
- Bayés De Luna A, Platonov P, Cosio FG, Cygankiewicz I, Pastore C, Baranowski R, et al. Interatrial blocks. A separate entity from left atrial enlargement: A consensus report. J Electrocardiol [Internet]. 2012;45(5):445–51.
- McGinn S, White PD. Acute cor pulmonale resulting from pulmonary embolism. J Am Med Assoc. 1935;104(17):1473
- Smaniotto MF, Alencar E Silva GPS, Heringer J de N, Almeida MT de C, Scheffer MK, Felicioni SP, et al. Classical ECG findings in pulmonary embolism have minimal diagnostic accuracy: A cross-sectional study. J Investig Med Off Publ Am Fed Clin Res. June 30, 2025;10815589251357621.
- Brugada P, Brugada J, Mont L, Smeets J, Andries EW. A new approach to the differential diagnosis of a regular tachycardia with a wide QRS complex. Circulation. 1991 May;83(5):1649–59.
- Bayes de Luna A, Zareba W, Fiol M, Nikus K, Birnbaum Y, Baranowski R, et al. Negative T wave in ischemic heart disease: A consensus article. Annals of Noninvasive Electrocardiology 2014;19(5):426–41.
- Bayés de Luna A, Wagner G, Birnbaum Y, Nikus K, Fiol M, Gorgels A, et al. A New Terminology for Left Ventricular Walls and Location of Myocardial Infarcts That Present Q Wave Based on the Standard of Cardiac Magnetic Resonance Imaging. Circulation. 2006;114(16):1755–60.
- de Alencar JN, Amorim EF, Scheffer MK, Felicioni SP, De Marchi MFN. Poor evidence for poor R wave progression in coronary disease: A scoping review. J Electrocardiol. 2024;84(500):145–50.
- Jastrzebski M, Kukla P, Czarnecka D, Kawecka-Jaszcz K. Comparison of five electrocardiographic methods for differentiation of wide QRS-complex tachycardias. EP Europace 2012;14(8):1165–71.
- Bacharova L. ECG in left ventricular hypertrophy: A change in paradigm from assessing left ventricular mass to its electrophysiological properties. J Electrocardiol 2022;73(May):153–6.